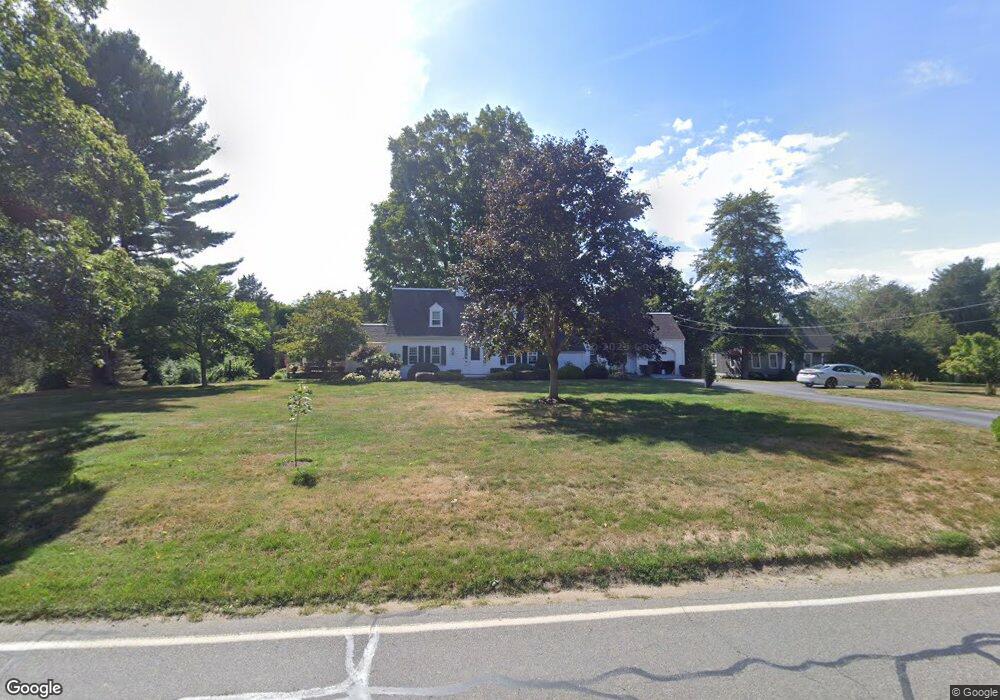
117 S Main St Berkley, MA 02779
Berkley Bridge/Lower Berkley NeighborhoodEstimated Value: $667,594 - $742,000
4
Beds
3
Baths
2,349
Sq Ft
$302/Sq Ft
Est. Value
About This Home
This home is located at 117 S Main St, Berkley, MA 02779 and is currently estimated at $709,649, approximately $302 per square foot. 117 S Main St is a home located in Bristol County with nearby schools including Berkley Community School.
Ownership History
Date
Name
Owned For
Owner Type
Purchase Details
Closed on
Nov 21, 2019
Sold by
White Gayla A
Bought by
Gayla A White Lt
Current Estimated Value
Purchase Details
Closed on
Aug 16, 1990
Sold by
Fazio Thomas
Bought by
Duarte Roger S
Create a Home Valuation Report for This Property
The Home Valuation Report is an in-depth analysis detailing your home's value as well as a comparison with similar homes in the area
Home Values in the Area
Average Home Value in this Area
Purchase History
| Date | Buyer | Sale Price | Title Company |
|---|---|---|---|
| Gayla A White Lt | -- | None Available | |
| Roger S Duarte Lt | -- | None Available | |
| Duarte Roger S | $162,000 | -- |
Source: Public Records
Mortgage History
| Date | Status | Borrower | Loan Amount |
|---|---|---|---|
| Previous Owner | Duarte Roger S | $280,000 | |
| Previous Owner | Duarte Roger S | $30,215 | |
| Previous Owner | Duarte Roger S | $133,500 | |
| Previous Owner | Duarte Roger S | $130,000 |
Source: Public Records
Tax History Compared to Growth
Tax History
| Year | Tax Paid | Tax Assessment Tax Assessment Total Assessment is a certain percentage of the fair market value that is determined by local assessors to be the total taxable value of land and additions on the property. | Land | Improvement |
|---|---|---|---|---|
| 2025 | $71 | $592,700 | $158,800 | $433,900 |
| 2024 | $6,910 | $555,000 | $136,800 | $418,200 |
| 2023 | $6,640 | $502,300 | $136,800 | $365,500 |
| 2022 | $6,489 | $471,900 | $118,900 | $353,000 |
| 2021 | $6,305 | $441,500 | $113,200 | $328,300 |
| 2020 | $6,124 | $421,500 | $100,200 | $321,300 |
| 2019 | $5,945 | $406,100 | $100,200 | $305,900 |
| 2018 | $5,450 | $388,700 | $96,400 | $292,300 |
| 2017 | $5,262 | $368,000 | $108,000 | $260,000 |
| 2016 | $5,057 | $340,800 | $108,000 | $232,800 |
| 2015 | $4,340 | $312,000 | $108,000 | $204,000 |
| 2014 | $4,150 | $324,000 | $117,200 | $206,800 |
Source: Public Records
Map
Nearby Homes
- 115 S Main St
- 121 S Main St
- 120 S Main St
- 113 S Main St
- 123 S Main St
- 124 S Main St
- 111 S Main St
- 116 S Main St
- 127 S Main St
- 126 S Main St
- 109 S Main St
- 129 S Main St
- 128 So Main St (Rear)
- 107 S Main St
- 130 S Main St
- 131 S Main St
- 105 S Main St
- 2 Tranquil Trail Unit S
- 2 Tranquil Trail
- 133 S Main St