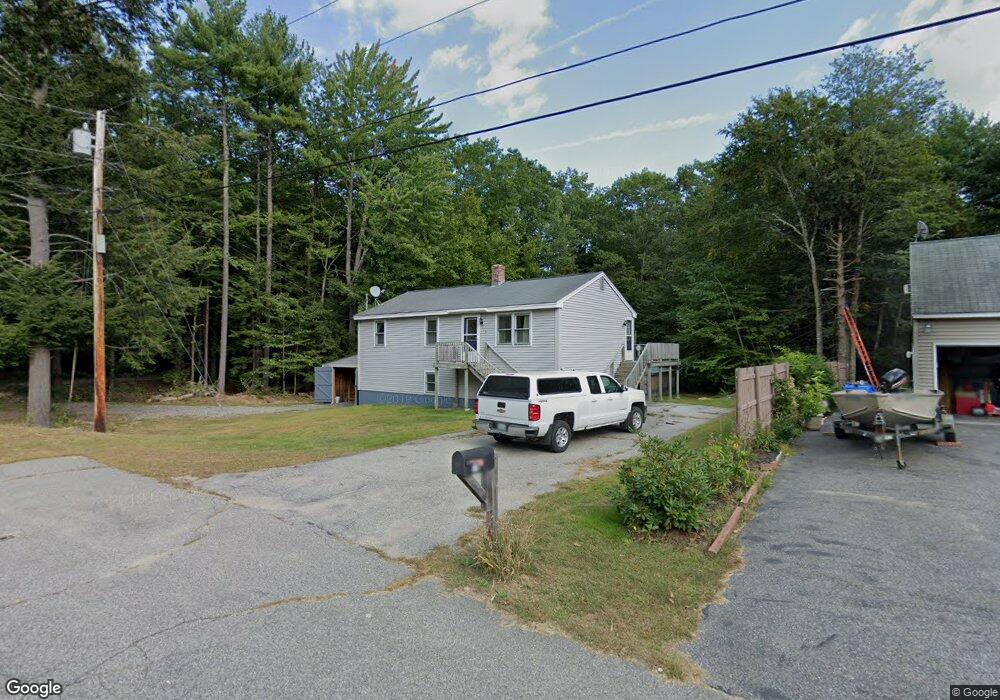
117 Sherburne St Springvale, ME 04083
Estimated Value: $427,000 - $455,000
4
Beds
2
Baths
1,862
Sq Ft
$237/Sq Ft
Est. Value
About This Home
This home is located at 117 Sherburne St, Springvale, ME 04083 and is currently estimated at $441,682, approximately $237 per square foot. 117 Sherburne St is a home located in York County with nearby schools including St Thomas Consolidated School and Sanford Christian Academy.
Ownership History
Date
Name
Owned For
Owner Type
Purchase Details
Closed on
Oct 21, 2010
Sold by
Berube Paul
Bought by
Federal National Mortgage Association
Current Estimated Value
Purchase Details
Closed on
Apr 22, 2005
Sold by
Berube Tambra J
Bought by
Berube Paul L
Home Financials for this Owner
Home Financials are based on the most recent Mortgage that was taken out on this home.
Original Mortgage
$174,444
Interest Rate
5%
Mortgage Type
Adjustable Rate Mortgage/ARM
Create a Home Valuation Report for This Property
The Home Valuation Report is an in-depth analysis detailing your home's value as well as a comparison with similar homes in the area
Home Values in the Area
Average Home Value in this Area
Purchase History
| Date | Buyer | Sale Price | Title Company |
|---|---|---|---|
| Federal National Mortgage Association | -- | -- | |
| Berube Paul L | -- | -- |
Source: Public Records
Mortgage History
| Date | Status | Borrower | Loan Amount |
|---|---|---|---|
| Previous Owner | Federal National Mortgage Association | $29,799 | |
| Previous Owner | Berube Paul L | $174,444 |
Source: Public Records
Tax History
| Year | Tax Paid | Tax Assessment Tax Assessment Total Assessment is a certain percentage of the fair market value that is determined by local assessors to be the total taxable value of land and additions on the property. | Land | Improvement |
|---|---|---|---|---|
| 2025 | $6,248 | $365,400 | $47,900 | $317,500 |
| 2024 | $5,898 | $365,400 | $47,900 | $317,500 |
| 2023 | $5,485 | $362,300 | $47,900 | $314,400 |
| 2022 | $5,362 | $362,300 | $47,900 | $314,400 |
| 2021 | $5,298 | $291,400 | $47,900 | $243,500 |
| 2020 | $5,024 | $249,200 | $47,900 | $201,300 |
| 2019 | $4,802 | $232,000 | $47,900 | $184,100 |
| 2018 | $4,559 | $222,400 | $47,900 | $174,500 |
| 2017 | $4,374 | $210,900 | $47,900 | $163,000 |
| 2016 | $4,578 | $201,300 | $47,900 | $153,400 |
| 2015 | $4,512 | $214,700 | $57,300 | $157,400 |
| 2014 | $4,473 | $216,900 | $59,500 | $157,400 |
| 2013 | -- | $216,900 | $59,500 | $157,400 |
Source: Public Records
Map
Nearby Homes
- 2 Libby Ln
- 11 Nathan Ct
- 21 Signal St Unit I-3
- 27 Weeman St
- 5 Allenson St
- 14 Webster St
- R6-41-S3 Railroad Ave
- R6-41-S2 Railroad Ave
- R6-41-S4 Railroad Ave
- 19 Signal St Unit I-2
- 17 Signal St Unit I-1
- 45 Payne St
- 51 Pleasant St
- 6 Harris St
- 39 Payne St
- 14 Pleasant St
- 3 George St
- 5 Goodwin St
- R6-41-S5 Ridley Rd
- R6-41-S6 Ridley Rd
- 111 Sherburne St
- 115 Sherburne St
- 1 Carpenter St
- 110 Sherburne St
- 101 Sherburne St
- 3 Carpenter St
- 4 Carpenter St
- 97 Sherburne St
- 97 Sherburne St
- 3 Barbara St
- 6 Carpenter St
- 95 Sherburne St
- 5 Carpenter St
- 9 Barbara St
- 6 Barbara St
- 8 Barbara St
- 91 Sherburne St
- 13 Barbara St
- 10 Barbara St
- 7 Carpenter St
Your Personal Tour Guide
Ask me questions while you tour the home.