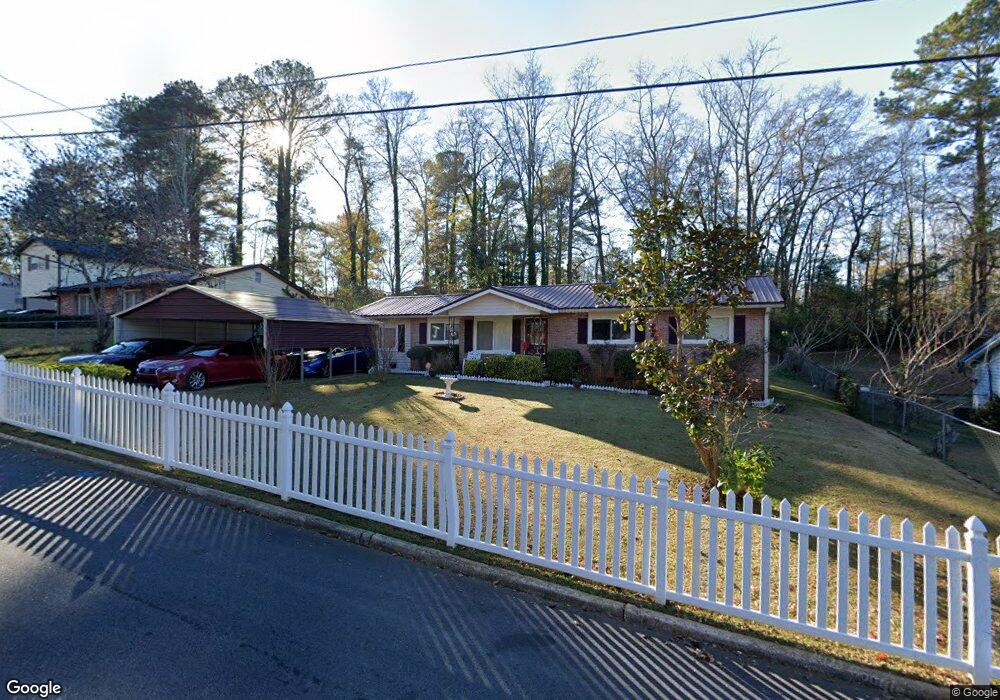
117 Sir Lancelot St Lagrange, GA 30241
Estimated Value: $143,000 - $206,000
3
Beds
2
Baths
1,412
Sq Ft
$121/Sq Ft
Est. Value
About This Home
This home is located at 117 Sir Lancelot St, Lagrange, GA 30241 and is currently estimated at $171,458, approximately $121 per square foot. 117 Sir Lancelot St is a home located in Troup County with nearby schools including Callaway Elementary School, Hogansville Elementary School, and Callaway Middle School.
Ownership History
Date
Name
Owned For
Owner Type
Purchase Details
Closed on
Jun 5, 2000
Sold by
James Hayes
Bought by
Hayes Blanche and Hayes James
Current Estimated Value
Purchase Details
Closed on
Mar 30, 2000
Sold by
Blanche Irvin Hayes
Bought by
James Hayes
Purchase Details
Closed on
Apr 17, 1979
Sold by
Rebecca Michael P and Rebecca Payant
Bought by
Blanche Irvin Hayes
Purchase Details
Closed on
Mar 4, 1977
Sold by
Beverly Riley and Beverly Seibenhener
Bought by
Rebecca Michael P and Rebecca Payant
Purchase Details
Closed on
Jan 1, 1973
Sold by
William L Mcdonald
Bought by
Beverly Riley and Beverly Seibenhener
Purchase Details
Closed on
Jan 1, 1972
Sold by
Rhonda Walter and Rhonda Donaldson
Bought by
William L Mcdonald
Purchase Details
Closed on
Jan 1, 1971
Sold by
Don R Jenkins
Bought by
Camelot Builders
Purchase Details
Closed on
Oct 24, 1968
Sold by
Mrs J T Whitaker
Bought by
Don R Jenkins
Create a Home Valuation Report for This Property
The Home Valuation Report is an in-depth analysis detailing your home's value as well as a comparison with similar homes in the area
Home Values in the Area
Average Home Value in this Area
Purchase History
| Date | Buyer | Sale Price | Title Company |
|---|---|---|---|
| Hayes Blanche | -- | -- | |
| James Hayes | -- | -- | |
| Blanche Irvin Hayes | $31,700 | -- | |
| Rebecca Michael P | -- | -- | |
| Beverly Riley | -- | -- | |
| William L Mcdonald | -- | -- | |
| Rhonda Walter | -- | -- | |
| Camelot Builders | -- | -- | |
| Don R Jenkins | -- | -- |
Source: Public Records
Tax History Compared to Growth
Tax History
| Year | Tax Paid | Tax Assessment Tax Assessment Total Assessment is a certain percentage of the fair market value that is determined by local assessors to be the total taxable value of land and additions on the property. | Land | Improvement |
|---|---|---|---|---|
| 2024 | $1,485 | $56,440 | $10,000 | $46,440 |
| 2023 | $884 | $52,320 | $10,000 | $42,320 |
| 2022 | $1,204 | $45,120 | $5,320 | $39,800 |
| 2021 | $871 | $30,880 | $4,440 | $26,440 |
| 2020 | $871 | $30,880 | $4,440 | $26,440 |
| 2019 | $788 | $28,120 | $4,440 | $23,680 |
| 2018 | $740 | $26,532 | $4,452 | $22,080 |
| 2017 | $740 | $26,532 | $4,452 | $22,080 |
| 2016 | $720 | $25,869 | $4,452 | $21,417 |
| 2015 | $722 | $25,869 | $4,452 | $21,417 |
| 2014 | $689 | $24,742 | $4,452 | $20,290 |
| 2013 | -- | $26,291 | $4,452 | $21,839 |
Source: Public Records
Map
Nearby Homes
- 456 Brookstone Dr
- 113 Woodridge Cir
- 121 Woodridge Cir
- 719 Windstream Dr Unit B61
- 719 Windstream Dr
- 721 Windstream Dr Unit B62
- 207 Baileys Way
- 124 Shenandoah Ln
- 128 Shenandoah Ln Unit A67
- Hemingway Plan at Crossvine Village
- Mira Plan at Crossvine Village
- Cecil Plan at Crossvine Village
- Tucker FP Plan at Crossvine Village
- Sierra Plan at Crossvine Village
- Jodeco FP Plan at Crossvine Village
- Nottely Plan at Crossvine Village
- Carter Plan at Crossvine Village
- Winston Plan at Crossvine Village
- Nelson Plan at Crossvine Village
- Madison Plan at Crossvine Village
- 115 Sir Lancelot St
- 119 Sir Lancelot St
- 113 Sir Lancelot St
- 116 Sir Lancelot St
- 212 Whitaker St
- 114 Sir Lancelot St
- 210 Whitaker St
- 118 Sir Lancelot St
- 112 Sir Lancelot St
- 111 Sir Lancelot St
- 101 Sir Galahad St
- 213 Whitaker St
- 214 Whitaker St
- 103 Sir Galahad St
- 211 Whitaker St
- 110 Sir Lancelot St
- 105 Sir Galahad St
- 0 Sir Lancelot St Unit 3156965
- 123 King Arthur Dr
- 109 Sir Lancelot St