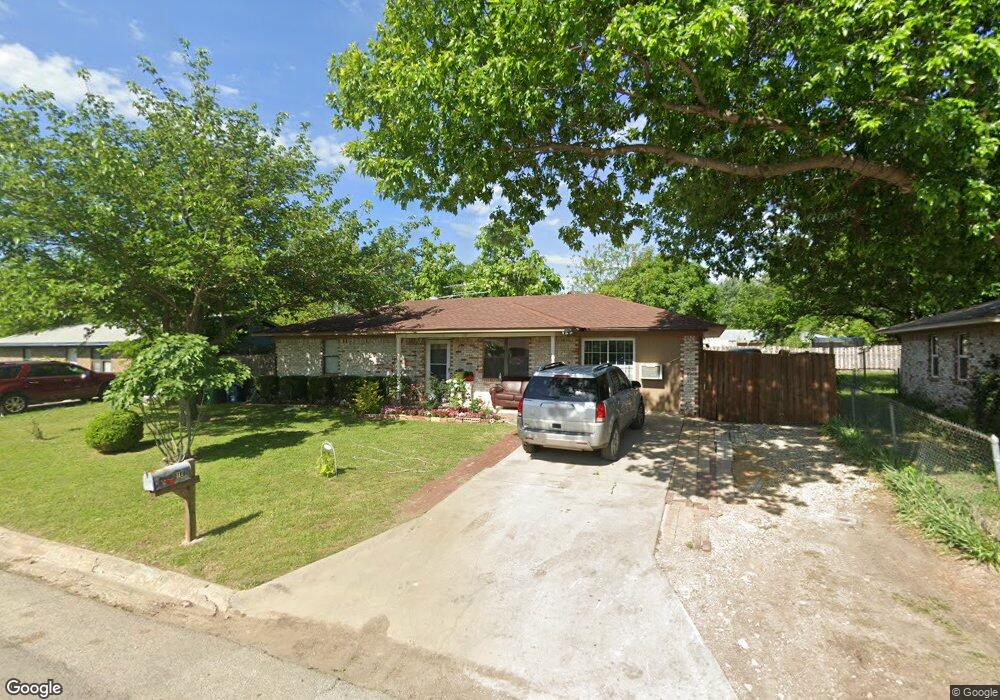
117 Southside Dr Sanger, TX 76266
Estimated Value: $213,000 - $230,000
3
Beds
1
Bath
1,200
Sq Ft
$185/Sq Ft
Est. Value
About This Home
This home is located at 117 Southside Dr, Sanger, TX 76266 and is currently estimated at $221,506, approximately $184 per square foot. 117 Southside Dr is a home located in Denton County with nearby schools including Chisholm Trail Elementary School, Clear Creek Intermediate School, and Sanger Sixth Grade Campus.
Ownership History
Date
Name
Owned For
Owner Type
Purchase Details
Closed on
Oct 27, 2020
Sold by
Jimenez Jose
Bought by
Soto Jaime Zepeda and Duran Lorena Gonzalez
Current Estimated Value
Home Financials for this Owner
Home Financials are based on the most recent Mortgage that was taken out on this home.
Original Mortgage
$136,000
Outstanding Balance
$115,691
Interest Rate
6.12%
Mortgage Type
New Conventional
Estimated Equity
$105,815
Purchase Details
Closed on
Jul 25, 2003
Sold by
Cravens Ava A
Bought by
Jimenez Jose
Home Financials for this Owner
Home Financials are based on the most recent Mortgage that was taken out on this home.
Original Mortgage
$68,309
Interest Rate
5.19%
Mortgage Type
FHA
Purchase Details
Closed on
Jul 21, 2003
Sold by
Cravens Albert L and Myers Patricia
Bought by
Cravens Ava A
Home Financials for this Owner
Home Financials are based on the most recent Mortgage that was taken out on this home.
Original Mortgage
$68,309
Interest Rate
5.19%
Mortgage Type
FHA
Create a Home Valuation Report for This Property
The Home Valuation Report is an in-depth analysis detailing your home's value as well as a comparison with similar homes in the area
Home Values in the Area
Average Home Value in this Area
Purchase History
| Date | Buyer | Sale Price | Title Company |
|---|---|---|---|
| Soto Jaime Zepeda | -- | None Available | |
| Jimenez Jose | -- | -- | |
| Cravens Ava A | -- | -- | |
| Cravens Ava A | -- | -- |
Source: Public Records
Mortgage History
| Date | Status | Borrower | Loan Amount |
|---|---|---|---|
| Open | Soto Jaime Zepeda | $136,000 | |
| Previous Owner | Jimenez Jose | $68,309 |
Source: Public Records
Tax History
| Year | Tax Paid | Tax Assessment Tax Assessment Total Assessment is a certain percentage of the fair market value that is determined by local assessors to be the total taxable value of land and additions on the property. | Land | Improvement |
|---|---|---|---|---|
| 2025 | $3,931 | $179,725 | $68,188 | $111,537 |
| 2024 | $3,931 | $194,524 | $68,188 | $126,336 |
| 2023 | $3,605 | $177,902 | $51,141 | $126,761 |
| 2022 | $3,528 | $159,097 | $51,141 | $107,956 |
| 2021 | $2,754 | $131,051 | $32,815 | $98,236 |
| 2020 | $2,114 | $95,538 | $32,815 | $73,100 |
| 2019 | $1,977 | $86,853 | $32,815 | $72,147 |
| 2018 | $1,807 | $78,957 | $23,440 | $55,517 |
| 2017 | $1,770 | $76,954 | $23,440 | $67,307 |
| 2016 | $910 | $39,571 | $6,819 | $32,752 |
| 2015 | $1,138 | $63,598 | $13,638 | $53,821 |
| 2014 | $1,138 | $57,816 | $17,938 | $39,878 |
| 2013 | -- | $55,774 | $17,938 | $37,836 |
Source: Public Records
Map
Nearby Homes
- 1012 Cowling Rd
- 327 Deer Run Dr
- 2000 S Stemmons St
- 2004 S Stemmons St
- 307 Quail Crossing Dr
- 141 Ringneck Dr
- 140 Ringneck Dr
- 226 Hillcrest St
- 136 Eider Dr
- 124 Morning Glory
- 113 Kincaid Dr
- Tbd I35
- 108 Eider Dr
- 117 Kathryn Dr
- 113 Diane Dr
- 188 Aster Dr
- 185 Aster Dr
- 141 Shady Grove Dr
- 505 Houston St
- 0000 Rector Rd
- 119 Southside Dr
- 115 Southside Dr
- 118 Southmeadow Dr
- 121 Southside Dr
- 116 Southmeadow Dr
- 113 Southside Dr
- 120 Southmeadow Dr
- 114 Southmeadow Dr
- 118 Southside Dr
- 120 Southside Dr
- 116 Southside Dr
- 111 Southside Dr
- 122 Southside Dr
- 123 Southside Dr
- 112 Southmeadow Dr
- 100 Southpark Ct
- 114 Southside Dr
- 124 Southside Dr
- 109 Southside Dr
- 125 Southside Dr
Your Personal Tour Guide
Ask me questions while you tour the home.