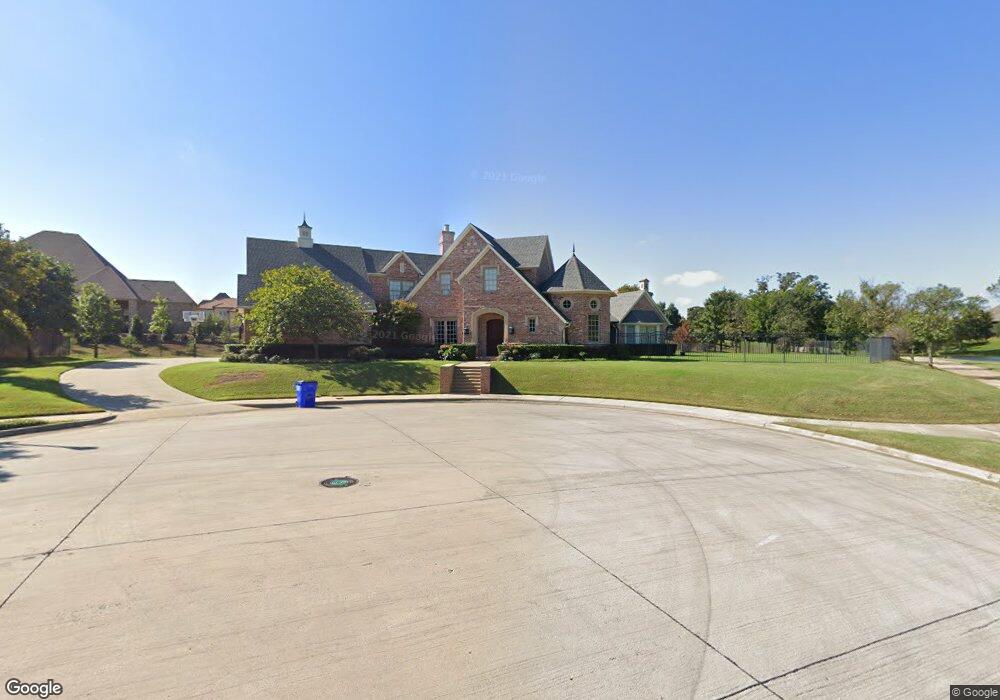
117 Stillwater Cir Colleyville, TX 76034
Estimated Value: $1,301,000 - $1,386,000
4
Beds
5
Baths
4,887
Sq Ft
$273/Sq Ft
Est. Value
About This Home
This home is located at 117 Stillwater Cir, Colleyville, TX 76034 and is currently estimated at $1,334,369, approximately $273 per square foot. 117 Stillwater Cir is a home located in Tarrant County with nearby schools including Liberty Elementary School, Bear Creek Intermediate School, and Keller Middle School.
Ownership History
Date
Name
Owned For
Owner Type
Purchase Details
Closed on
Feb 12, 2020
Sold by
Cartus Financial Corporation
Bought by
Lec Jennifer Fang
Current Estimated Value
Purchase Details
Closed on
Feb 1, 2020
Sold by
Lee Alex G and Ng Valerie
Bought by
Cartus Financial Corporation
Purchase Details
Closed on
Sep 29, 2017
Sold by
Blaser Jason and Blaser Theresa
Bought by
Lee Alex G and Ng Valerie
Home Financials for this Owner
Home Financials are based on the most recent Mortgage that was taken out on this home.
Original Mortgage
$584,000
Interest Rate
3.89%
Mortgage Type
New Conventional
Purchase Details
Closed on
Jul 27, 2005
Sold by
Old Grove Lp
Bought by
Blaser Jason and Blaser Theresa
Home Financials for this Owner
Home Financials are based on the most recent Mortgage that was taken out on this home.
Original Mortgage
$549,000
Interest Rate
6.37%
Mortgage Type
Construction
Create a Home Valuation Report for This Property
The Home Valuation Report is an in-depth analysis detailing your home's value as well as a comparison with similar homes in the area
Home Values in the Area
Average Home Value in this Area
Purchase History
| Date | Buyer | Sale Price | Title Company |
|---|---|---|---|
| Lec Jennifer Fang | -- | None Available | |
| Cartus Financial Corporation | -- | None Available | |
| Lee Alex G | -- | Old Republic Title | |
| Blaser Jason | -- | -- |
Source: Public Records
Mortgage History
| Date | Status | Borrower | Loan Amount |
|---|---|---|---|
| Previous Owner | Lee Alex G | $584,000 | |
| Previous Owner | Blaser Jason | $549,000 |
Source: Public Records
Tax History Compared to Growth
Tax History
| Year | Tax Paid | Tax Assessment Tax Assessment Total Assessment is a certain percentage of the fair market value that is determined by local assessors to be the total taxable value of land and additions on the property. | Land | Improvement |
|---|---|---|---|---|
| 2025 | $13,812 | $1,353,117 | $289,998 | $1,063,119 |
| 2024 | $13,812 | $1,353,117 | $289,998 | $1,063,119 |
| 2023 | $16,786 | $1,345,282 | $289,998 | $1,055,284 |
| 2022 | $17,466 | $1,083,215 | $289,998 | $793,217 |
| 2021 | $17,157 | $750,000 | $181,500 | $568,500 |
| 2020 | $17,278 | $750,000 | $181,500 | $568,500 |
| 2019 | $18,190 | $750,000 | $181,500 | $568,500 |
| 2018 | $14,994 | $730,390 | $181,500 | $548,890 |
| 2017 | $17,699 | $712,000 | $100,000 | $612,000 |
| 2016 | $16,663 | $670,353 | $100,000 | $570,353 |
| 2015 | $15,658 | $626,200 | $100,000 | $526,200 |
| 2014 | $15,658 | $626,200 | $100,000 | $526,200 |
Source: Public Records
Map
Nearby Homes
- 7115 Cast Iron Forest Trail
- 204 Old Grove Rd
- 7212 John Mccain Rd
- 7400 John Mccain Rd
- 510 Bandit Trail
- 512 Bandit Trail
- 6108 Westcoat Dr
- 6776 St Moritz Pkwy
- 6912 Handel
- 7607 Monticello Pkwy
- 7511 Mount Vernon Dr
- 203 Polo Trail
- 6809 Strauss
- 7702 Tillman Hill Rd
- 6401 Westcoat Dr
- 6900 Sir Spencer Ct
- 912 Chateau Ct
- 1010 W Mcdonwell School Rd
- 7033 Benjamin
- 803 Marie Dr
- 208 Waterfall Ct
- 212 Waterfall Ct
- 113 Stillwater Cir
- 204 Waterfall Ct
- 109 Stillwater Cir
- 200 Waterfall Ct
- 7215 John Mccain Rd
- 209 Waterfall Ct
- 105 Stillwater Cir
- 217 Waterfall Ct
- 213 Waterfall Ct
- 104 Waterfall Ct
- 205 Waterfall Ct
- 301 Waterfall Ct
- 101 Stillwater Cir
- 201 Waterfall Ct
- 305 Waterfall Ct
- 100 Waterfall Ct
- 7105 Vanguard Ct
- 105 Waterfall Ct