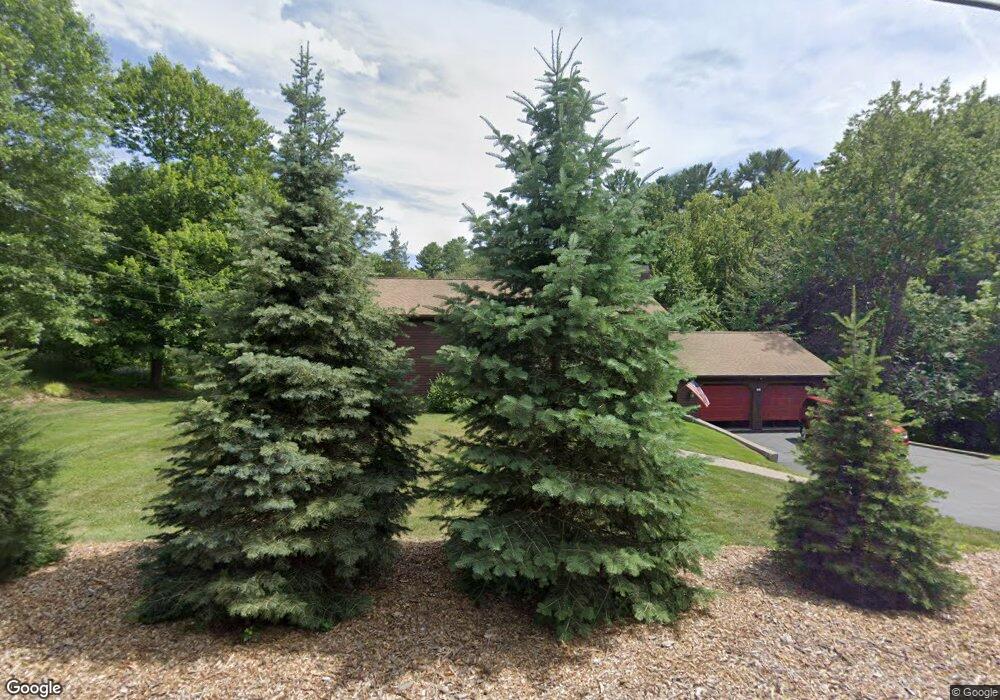
117 Summer St Rehoboth, MA 02769
Estimated Value: $558,000 - $755,000
3
Beds
2
Baths
1,300
Sq Ft
$478/Sq Ft
Est. Value
About This Home
This home is located at 117 Summer St, Rehoboth, MA 02769 and is currently estimated at $621,309, approximately $477 per square foot. 117 Summer St is a home located in Bristol County with nearby schools including Dighton-Rehoboth Regional High School and Cedar Brook School.
Ownership History
Date
Name
Owned For
Owner Type
Purchase Details
Closed on
Feb 10, 2014
Sold by
Lynch Joel and Lynch Laura
Bought by
Retriever Ret
Current Estimated Value
Purchase Details
Closed on
Jun 11, 2012
Sold by
Quinn Kevin R and Quinn Karen M
Bought by
Retriver Ret and Quinn Kevin R
Purchase Details
Closed on
Jan 20, 1993
Sold by
Household Fin Corp 2
Bought by
Quinn Kevin R
Home Financials for this Owner
Home Financials are based on the most recent Mortgage that was taken out on this home.
Original Mortgage
$139,950
Interest Rate
8.15%
Mortgage Type
Purchase Money Mortgage
Purchase Details
Closed on
Jul 6, 1992
Sold by
Lopes Manuel A
Bought by
Household Fin Corp
Purchase Details
Closed on
Sep 15, 1988
Sold by
L & L Investments
Bought by
Lopes Manuel
Home Financials for this Owner
Home Financials are based on the most recent Mortgage that was taken out on this home.
Original Mortgage
$109,000
Interest Rate
10.43%
Mortgage Type
Purchase Money Mortgage
Create a Home Valuation Report for This Property
The Home Valuation Report is an in-depth analysis detailing your home's value as well as a comparison with similar homes in the area
Home Values in the Area
Average Home Value in this Area
Purchase History
| Date | Buyer | Sale Price | Title Company |
|---|---|---|---|
| Retriever Ret | $2,000 | -- | |
| Retriver Ret | -- | -- | |
| Quinn Kevin R | $155,500 | -- | |
| Household Fin Corp | $131,471 | -- | |
| Lopes Manuel | $199,000 | -- |
Source: Public Records
Mortgage History
| Date | Status | Borrower | Loan Amount |
|---|---|---|---|
| Previous Owner | Lopes Manuel | $75,000 | |
| Previous Owner | Lopes Manuel | $139,950 | |
| Previous Owner | Lopes Manuel | $52,200 | |
| Previous Owner | Lopes Manuel | $109,000 |
Source: Public Records
Tax History
| Year | Tax Paid | Tax Assessment Tax Assessment Total Assessment is a certain percentage of the fair market value that is determined by local assessors to be the total taxable value of land and additions on the property. | Land | Improvement |
|---|---|---|---|---|
| 2025 | $49 | $440,800 | $192,300 | $248,500 |
| 2024 | $5,169 | $455,000 | $192,300 | $262,700 |
| 2023 | $4,709 | $425,100 | $188,300 | $236,800 |
| 2022 | $4,709 | $371,700 | $179,900 | $191,800 |
| 2021 | $4,610 | $348,200 | $163,600 | $184,600 |
| 2020 | $4,277 | $326,000 | $163,600 | $162,400 |
| 2018 | $3,461 | $289,100 | $155,800 | $133,300 |
| 2017 | $3,445 | $274,300 | $155,800 | $118,500 |
| 2016 | $3,373 | $277,600 | $155,800 | $121,800 |
| 2015 | $3,276 | $266,100 | $148,600 | $117,500 |
| 2014 | $3,065 | $246,400 | $140,800 | $105,600 |
Source: Public Records
Map
Nearby Homes
- 111 Summer St
- 20 School St
- 0 Winter St
- 321 Winthrop St
- 8 Linden Ln
- 8 Linden Ln
- 248 County
- 23 Colonial Way
- 197 Chestnut St
- 145 Winthrop St
- 139 Winthrop St
- 67 Wheeler St
- 15 Hickory Ridge Rd
- 185 Moulton St
- 23 Bay State Rd
- 0 Winthrop St Unit 73180872
- 42 Linden Ln
- 349 Anawan St
- 16 Salisbury St
- 46 Mikayla Ann Dr
Your Personal Tour Guide
Ask me questions while you tour the home.