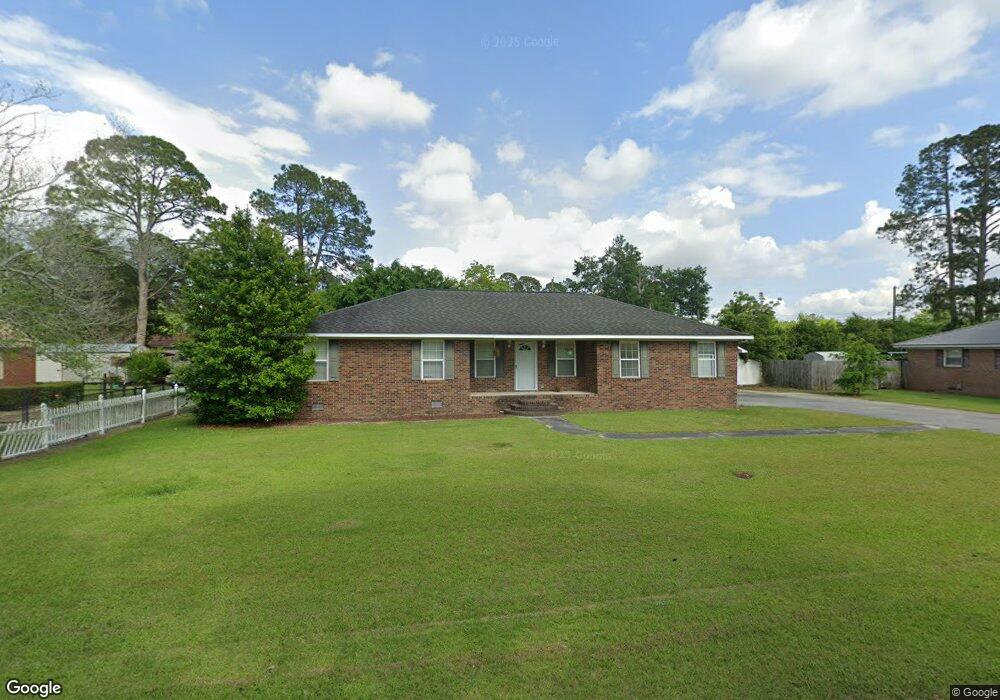
117 Traylor Ave Fitzgerald, GA 31750
Estimated Value: $149,000 - $165,389
3
Beds
2
Baths
1,483
Sq Ft
$107/Sq Ft
Est. Value
About This Home
This home is located at 117 Traylor Ave, Fitzgerald, GA 31750 and is currently estimated at $158,597, approximately $106 per square foot. 117 Traylor Ave is a home located in Ben Hill County with nearby schools including Ben Hill County Primary School, Ben Hill Elementary School, and Ben Hill County Middle School.
Ownership History
Date
Name
Owned For
Owner Type
Purchase Details
Closed on
Mar 13, 2008
Sold by
Wyn Rachel Milligan
Bought by
Wynn Rachel M
Current Estimated Value
Home Financials for this Owner
Home Financials are based on the most recent Mortgage that was taken out on this home.
Original Mortgage
$50,910
Interest Rate
5.68%
Mortgage Type
New Conventional
Purchase Details
Closed on
Dec 3, 2007
Sold by
Wynn Rachel Milligan
Bought by
Milligan Richard E
Purchase Details
Closed on
Mar 29, 2005
Sold by
Milligan Richard E
Bought by
Milligan Richard E and Milligan Patsy D
Purchase Details
Closed on
Apr 17, 1995
Sold by
Milligan Richard E
Bought by
Milligan Richard E
Purchase Details
Closed on
Feb 8, 1995
Sold by
Payne Vonceil
Bought by
Milligan Richard E
Purchase Details
Closed on
Jun 4, 1990
Bought by
Payne Vonceil
Create a Home Valuation Report for This Property
The Home Valuation Report is an in-depth analysis detailing your home's value as well as a comparison with similar homes in the area
Home Values in the Area
Average Home Value in this Area
Purchase History
| Date | Buyer | Sale Price | Title Company |
|---|---|---|---|
| Wynn Rachel M | -- | -- | |
| Wynn Rachel M | $45,000 | -- | |
| Milligan Richard E | -- | -- | |
| Milligan Richard E | -- | -- | |
| Milligan Richard E | -- | -- | |
| Milligan Richard E | $7,000 | -- | |
| Payne Vonceil | -- | -- |
Source: Public Records
Mortgage History
| Date | Status | Borrower | Loan Amount |
|---|---|---|---|
| Closed | Wynn Rachel M | $50,910 |
Source: Public Records
Tax History Compared to Growth
Tax History
| Year | Tax Paid | Tax Assessment Tax Assessment Total Assessment is a certain percentage of the fair market value that is determined by local assessors to be the total taxable value of land and additions on the property. | Land | Improvement |
|---|---|---|---|---|
| 2024 | $1,830 | $47,210 | $3,200 | $44,010 |
| 2023 | $676 | $46,040 | $3,200 | $42,840 |
| 2022 | $1,138 | $40,411 | $3,200 | $37,211 |
| 2021 | $1,137 | $39,095 | $3,200 | $35,895 |
| 2020 | $1,125 | $38,358 | $3,200 | $35,158 |
| 2019 | $1,120 | $38,358 | $3,200 | $35,158 |
| 2018 | $1,643 | $38,139 | $3,200 | $34,939 |
| 2017 | $1,108 | $37,847 | $3,200 | $34,647 |
| 2016 | $1,054 | $37,694 | $3,200 | $34,494 |
| 2015 | -- | $37,997 | $3,200 | $34,797 |
| 2014 | -- | $38,603 | $3,200 | $35,403 |
Source: Public Records
Map
Nearby Homes
- 109 Pearl Place
- 137 Atlantic Ave
- 118 Patton Ave
- 141 Turner Ave
- 111 Duane Dr
- 200 Irwinville Hwy
- 204 Irwinville Hwy
- 118 Irwinville Hwy
- 807 W Oconee St
- 102 Irwinville Hwy
- 816 W Central Ave
- 113 S Merrimac Dr
- 809 W Pine St
- 906 N Merrimac Dr
- 0 Lincoln Ave
- 710 W Central Ave
- 107 Manassas Place
- 606 W Suwanee St
- 613 W Central Ave
- 249 Lincoln Ave
- 121 Traylor Ave
- 113 Traylor Ave
- 113 Traylor Ave
- 118 Turner Ave
- 114 Turner Ave
- 120 Turner Ave
- 114 Traylor Ave
- 120 Traylor Ave
- 112 Turner Ave
- 125 Traylor Ave
- 109 Traylor Ave
- 110 Traylor Ave
- 108 Turner Ave
- 126 Turner Ave
- 124 Traylor Ave
- 117 Pearl Place
- 119 Turner Ave
- 115 Turner Ave
- 121 Turner Ave
- 113 Pearl Place