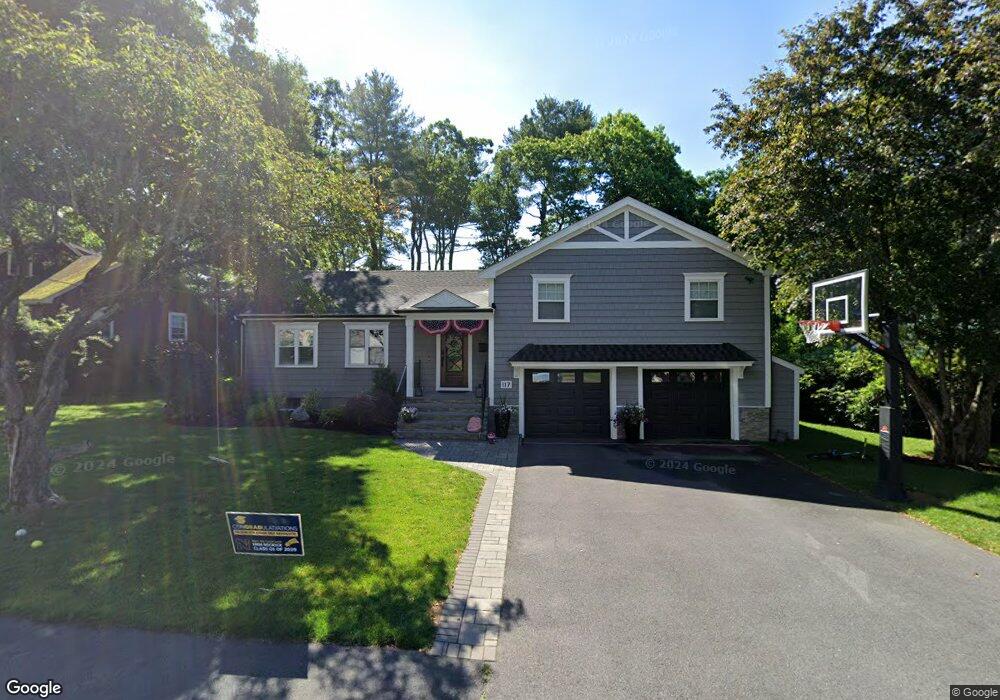
117 Tudor Rd Needham, MA 02492
Estimated Value: $1,428,000 - $1,758,678
3
Beds
3
Baths
982
Sq Ft
$1,610/Sq Ft
Est. Value
About This Home
This home is located at 117 Tudor Rd, Needham, MA 02492 and is currently estimated at $1,581,420, approximately $1,610 per square foot. 117 Tudor Rd is a home located in Norfolk County with nearby schools including Broadmeadow Elementary School, High Rock Middle School, and Pollard Middle School.
Ownership History
Date
Name
Owned For
Owner Type
Purchase Details
Closed on
Mar 17, 1978
Bought by
Finn Peter B and Finn Nancy B
Current Estimated Value
Create a Home Valuation Report for This Property
The Home Valuation Report is an in-depth analysis detailing your home's value as well as a comparison with similar homes in the area
Home Values in the Area
Average Home Value in this Area
Purchase History
| Date | Buyer | Sale Price | Title Company |
|---|---|---|---|
| Finn Peter B | $80,000 | -- |
Source: Public Records
Mortgage History
| Date | Status | Borrower | Loan Amount |
|---|---|---|---|
| Open | Finn Peter B | $625,000 | |
| Closed | Finn Peter B | $135,000 | |
| Closed | Finn Peter B | $100,000 |
Source: Public Records
Tax History
| Year | Tax Paid | Tax Assessment Tax Assessment Total Assessment is a certain percentage of the fair market value that is determined by local assessors to be the total taxable value of land and additions on the property. | Land | Improvement |
|---|---|---|---|---|
| 2025 | $15,672 | $1,478,500 | $801,300 | $677,200 |
| 2024 | $13,189 | $1,053,400 | $589,900 | $463,500 |
| 2023 | $13,286 | $1,018,900 | $589,900 | $429,000 |
| 2022 | $12,538 | $937,800 | $522,100 | $415,700 |
| 2021 | $12,220 | $937,800 | $522,100 | $415,700 |
| 2020 | $11,321 | $906,400 | $522,000 | $384,400 |
| 2019 | $10,585 | $854,300 | $474,600 | $379,700 |
| 2018 | $10,149 | $854,300 | $474,600 | $379,700 |
| 2017 | $9,158 | $770,200 | $474,600 | $295,600 |
| 2016 | $8,888 | $770,200 | $474,600 | $295,600 |
| 2015 | $8,696 | $770,200 | $474,600 | $295,600 |
| 2014 | $7,986 | $686,100 | $395,600 | $290,500 |
Source: Public Records
Map
Nearby Homes
- 176 Highgate St
- 31 Birds Hill Ave
- 883 Greendale Ave
- 68 Brookline St
- 60 Douglas Rd
- 190 Brookline St
- 126 Prince St
- 28 Green St
- 17 Lindbergh Ave
- 36 Otis St Unit 36
- 100 Bradford St
- 638 Webster St
- 638 Webster St Unit 638
- 50 Sterling Rd
- 242 Valley Rd
- 1204 Greendale Ave Unit 128
- 1202 Greendale Ave Unit 133
- 1202 Greendale Ave Unit 124
- 1206 Greendale Ave Unit 217
- 1206 Greendale Ave Unit 201
Your Personal Tour Guide
Ask me questions while you tour the home.