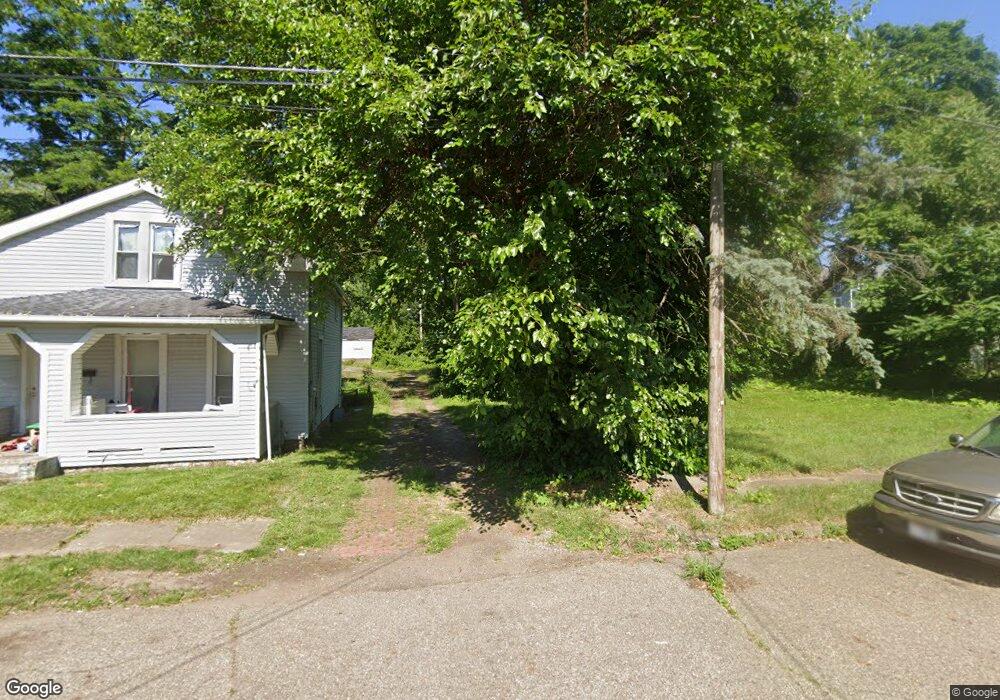
117 Verna Ct SE Massillon, OH 44646
Downtown Massillon NeighborhoodEstimated Value: $189,000 - $344,000
3
Beds
1
Bath
1,248
Sq Ft
$193/Sq Ft
Est. Value
About This Home
This home is located at 117 Verna Ct SE, Massillon, OH 44646 and is currently estimated at $241,333, approximately $193 per square foot. 117 Verna Ct SE is a home located in Stark County with nearby schools including Massillon Intermediate School, Massillon Junior High School, and Washington High School.
Ownership History
Date
Name
Owned For
Owner Type
Purchase Details
Closed on
Jul 27, 2023
Sold by
Stark County Land Reutilization Corporat
Bought by
City Of Massillon
Current Estimated Value
Purchase Details
Closed on
Mar 14, 2019
Sold by
Stark County Land Reutilization Corp
Bought by
Stark Cnty Regional Planning Commission
Purchase Details
Closed on
Jan 31, 2019
Sold by
Cowan Laverna M
Bought by
Stark County Land Reutilization Corp
Create a Home Valuation Report for This Property
The Home Valuation Report is an in-depth analysis detailing your home's value as well as a comparison with similar homes in the area
Home Values in the Area
Average Home Value in this Area
Purchase History
| Date | Buyer | Sale Price | Title Company |
|---|---|---|---|
| City Of Massillon | -- | None Listed On Document | |
| Stark Cnty Regional Planning Commission | -- | None Available | |
| Stark County Land Reutilization Corp | -- | None Available |
Source: Public Records
Tax History Compared to Growth
Tax History
| Year | Tax Paid | Tax Assessment Tax Assessment Total Assessment is a certain percentage of the fair market value that is determined by local assessors to be the total taxable value of land and additions on the property. | Land | Improvement |
|---|---|---|---|---|
| 2025 | -- | $1,860 | $1,860 | -- |
| 2024 | -- | $1,860 | $1,860 | -- |
| 2023 | $0 | $950 | $950 | $0 |
| 2022 | $522 | $950 | $950 | $0 |
| 2021 | $522 | $950 | $950 | $0 |
| 2020 | $228 | $6,830 | $2,030 | $4,800 |
| 2019 | $388 | $6,830 | $2,030 | $4,800 |
| 2018 | $715 | $6,830 | $2,030 | $4,800 |
| 2017 | $4,957 | $5,050 | $1,120 | $3,930 |
| 2016 | $4,066 | $5,880 | $910 | $4,970 |
| 2015 | $719 | $5,880 | $910 | $4,970 |
| 2014 | $935 | $6,060 | $950 | $5,110 |
| 2013 | $469 | $6,060 | $950 | $5,110 |
Source: Public Records
Map
Nearby Homes
- 233 Edwin Ave SE
- 17 Maple Ave SE
- 804 Erie St S
- 652 Young St SE
- 1225 Erie St S
- 1319 Walnut Rd SE
- 202 Rose Ave SE
- 1117 Cleveland St SW
- 1274 13th St SE
- 0 Pearl SE Unit 5155028
- 532 4th St SW
- 505 Neale Ave SW
- 824 Oak Ave SE
- 512 6th St SW
- 20 Forest Ave SE
- 22 Forest Ave SE
- 1738 Erie St S
- 46 5th St SE
- 25 Forest Ave SE
- 21 Forest Ave SE
- 116 Edwin Ave SE
- 124 Edwin Ave SE
- 104 Edwin Ave SE
- 822 1st St SE
- 826 1st St SE
- 128 Edwin Ave SE
- 829 2nd St SE
- 818 1st St SE
- 134 Edwin Ave SE
- 814 1st St SE
- 821 2nd St SE
- 129 Maple Ave SE
- 815 2nd St SE
- 34 Edwin Ave SE
- 117 Edwin Ave SE
- 115 Edwin Ave SE
- 123 Edwin Ave SE
- 123 Maple Ave SE
- 111 Maple Ave SE
- 111 Edwin Ave SE