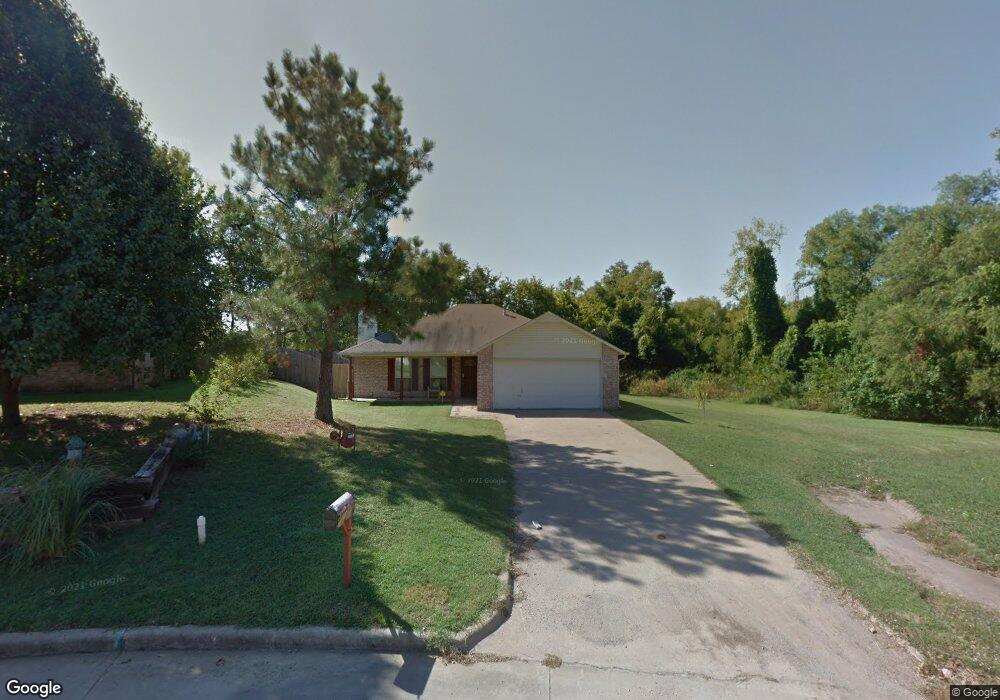
117 W 11th St S Unit South Claremore, OK 74017
Estimated Value: $181,000 - $212,093
3
Beds
2
Baths
1,214
Sq Ft
$162/Sq Ft
Est. Value
About This Home
This home is located at 117 W 11th St S Unit South, Claremore, OK 74017 and is currently estimated at $197,273, approximately $162 per square foot. 117 W 11th St S Unit South is a home located in Rogers County with nearby schools including Claremont Elementary School, Will Rogers Junior High School, and Claremore High School.
Ownership History
Date
Name
Owned For
Owner Type
Purchase Details
Closed on
Feb 28, 2017
Sold by
Keith Emily B and Keith Bradley
Bought by
Murrell Garrett G and Murrell Jennifer R
Current Estimated Value
Home Financials for this Owner
Home Financials are based on the most recent Mortgage that was taken out on this home.
Original Mortgage
$103,022
Outstanding Balance
$85,034
Interest Rate
4.09%
Mortgage Type
FHA
Estimated Equity
$112,239
Purchase Details
Closed on
Sep 23, 2010
Sold by
Brown Michele L
Bought by
Keith Emily B
Purchase Details
Closed on
May 5, 2005
Sold by
York Dick and Seifried Jim
Bought by
Pendergraff Michele L and Brown Scotty
Home Financials for this Owner
Home Financials are based on the most recent Mortgage that was taken out on this home.
Original Mortgage
$78,400
Interest Rate
6.03%
Mortgage Type
New Conventional
Purchase Details
Closed on
Jun 30, 1997
Sold by
York Dick Trustee
Create a Home Valuation Report for This Property
The Home Valuation Report is an in-depth analysis detailing your home's value as well as a comparison with similar homes in the area
Home Values in the Area
Average Home Value in this Area
Purchase History
| Date | Buyer | Sale Price | Title Company |
|---|---|---|---|
| Murrell Garrett G | $117,000 | First Title & Abstract Servi | |
| Keith Emily B | $99,000 | -- | |
| Pendergraff Michele L | $131,333 | Land Title Closing Services | |
| -- | -- | -- |
Source: Public Records
Mortgage History
| Date | Status | Borrower | Loan Amount |
|---|---|---|---|
| Open | Murrell Garrett G | $103,022 | |
| Previous Owner | Pendergraff Michele L | $78,400 |
Source: Public Records
Tax History Compared to Growth
Tax History
| Year | Tax Paid | Tax Assessment Tax Assessment Total Assessment is a certain percentage of the fair market value that is determined by local assessors to be the total taxable value of land and additions on the property. | Land | Improvement |
|---|---|---|---|---|
| 2025 | $1,548 | $16,748 | $3,224 | $13,524 |
| 2024 | $1,474 | $15,950 | $3,070 | $12,880 |
| 2023 | $1,474 | $15,191 | $2,814 | $12,377 |
| 2022 | $1,339 | $14,468 | $2,200 | $12,268 |
| 2021 | $1,217 | $13,781 | $2,200 | $11,581 |
| 2020 | $1,202 | $13,123 | $1,760 | $11,363 |
| 2019 | $1,166 | $12,589 | $1,760 | $10,829 |
| 2018 | $1,196 | $12,948 | $1,760 | $11,188 |
| 2017 | $830 | $10,036 | $1,320 | $8,716 |
| 2016 | $821 | $9,743 | $1,320 | $8,423 |
| 2015 | $785 | $9,460 | $1,320 | $8,140 |
| 2014 | $759 | $9,184 | $1,320 | $7,864 |
Source: Public Records
Map
Nearby Homes
- 121 W 9th Place S
- 203 W 9th St S
- 809 S Muskogee Ave
- 16111 Oklahoma 88
- 507 S Maryland Ave
- 321 E Patti Page Blvd
- 21755 Country Ridge Ln
- 402 E Patti Page Blvd
- 417 E Will Rogers Blvd
- 317 E 4th St
- 0 E 540 Unit 2531424
- 3304 Harbour Town
- 6050 E Chestnut
- 0 E 500 Unit 2545008
- 22037 Cliffside
- 3306 Harbour Town
- RC Fenway Plan at Red Plains
- RC Wright Plan at Red Plains
- RC Foster II Plan at Red Plains
- RC Armstrong II Plan at Red Plains
- 117 W 11th St S
- 117 W 11th St S Unit S
- 115 E 11th St S
- 115 W 11th St S
- 1107 S Chickasaw Place
- 100 E 11th St S
- 116 W 11th St
- 104 E 11th St S
- 101 E 10th St S
- 101 W 10th St S
- 105 E 11th St S
- 105 E 11th St S Unit South
- 1101 S Chickasaw Place
- 106 E 11th St S
- 107 E 11th St S
- 115 W 10th St S
- 105 E 10th St S
- 108 E 11th St S
- 102 E 11th St S
- 120 W 10th St S