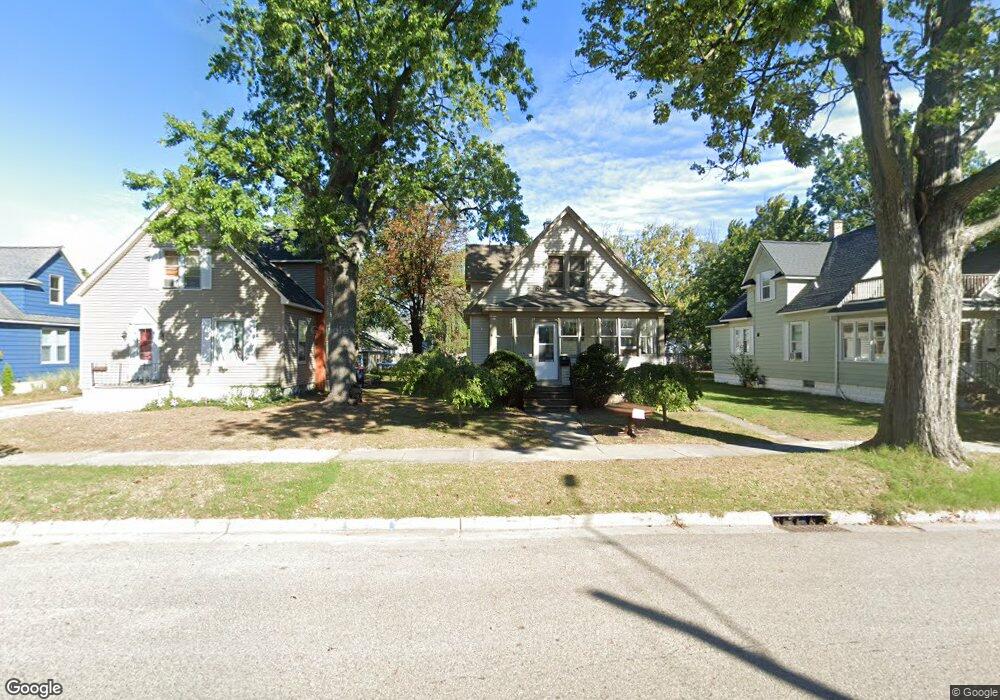
117 W 18th St Holland, MI 49423
Washington Square NeighborhoodEstimated Value: $254,000 - $274,000
4
Beds
1
Bath
1,041
Sq Ft
$255/Sq Ft
Est. Value
About This Home
This home is located at 117 W 18th St, Holland, MI 49423 and is currently estimated at $265,808, approximately $255 per square foot. 117 W 18th St is a home located in Ottawa County with nearby schools including Jefferson Elementary School, Maplewood, and Holland High School.
Ownership History
Date
Name
Owned For
Owner Type
Purchase Details
Closed on
Sep 30, 2024
Sold by
Hernandez Lourdes
Bought by
Hernandez Lourdes
Current Estimated Value
Purchase Details
Closed on
Jul 19, 2024
Sold by
Hernandez Efrain
Bought by
Hernandez Efrain and Hernandez Lourdes
Purchase Details
Closed on
Feb 15, 2000
Sold by
Wolters Warren
Bought by
Hernandez Efrain
Purchase Details
Closed on
Nov 22, 1991
Sold by
Wolters Warren
Create a Home Valuation Report for This Property
The Home Valuation Report is an in-depth analysis detailing your home's value as well as a comparison with similar homes in the area
Home Values in the Area
Average Home Value in this Area
Purchase History
| Date | Buyer | Sale Price | Title Company |
|---|---|---|---|
| Hernandez Lourdes | -- | None Listed On Document | |
| Hernandez Efrain | -- | None Listed On Document | |
| Hernandez Efrain | $81,900 | -- | |
| -- | $40,000 | -- |
Source: Public Records
Tax History Compared to Growth
Tax History
| Year | Tax Paid | Tax Assessment Tax Assessment Total Assessment is a certain percentage of the fair market value that is determined by local assessors to be the total taxable value of land and additions on the property. | Land | Improvement |
|---|---|---|---|---|
| 2025 | $1,782 | $107,500 | $0 | $0 |
| 2024 | $1,782 | $97,300 | $0 | $0 |
| 2023 | $3,320 | $80,700 | $0 | $0 |
| 2022 | $1,582 | $72,700 | $0 | $0 |
| 2021 | $1,539 | $69,700 | $0 | $0 |
| 2020 | $1,536 | $66,500 | $0 | $0 |
| 2019 | $1,549 | $59,900 | $0 | $0 |
| 2018 | $1,458 | $53,300 | $0 | $0 |
| 2017 | $1,413 | $53,300 | $0 | $0 |
| 2016 | $1,413 | $45,100 | $0 | $0 |
| 2015 | $1,368 | $42,100 | $0 | $0 |
| 2014 | $1,368 | $39,500 | $0 | $0 |
Source: Public Records
Map
Nearby Homes