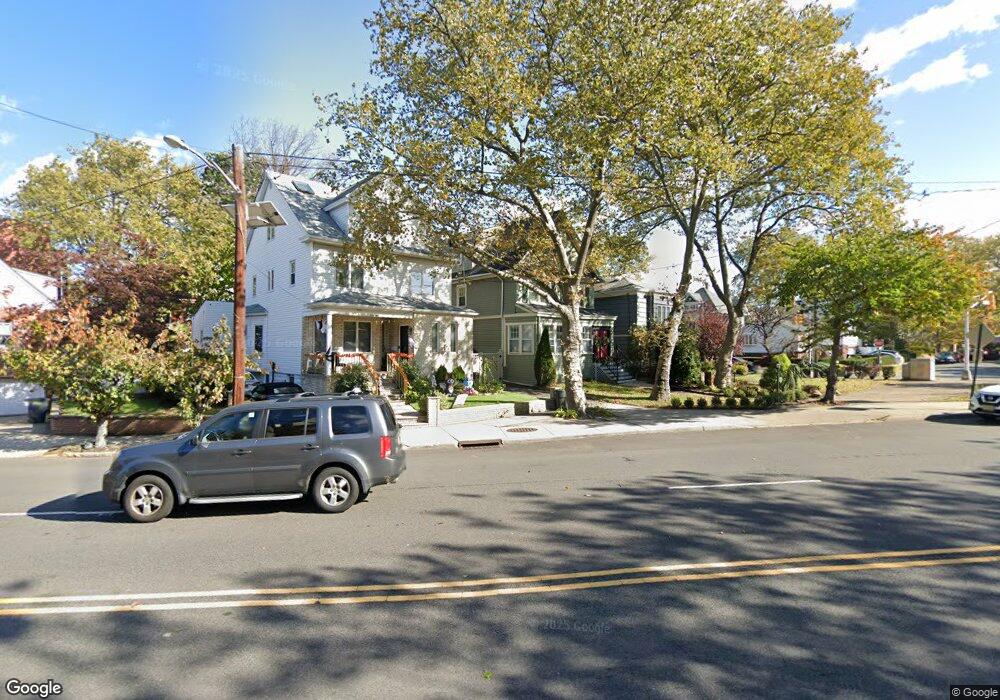
117 W 36th St Bayonne, NJ 07002
North Bayonne NeighborhoodEstimated Value: $1,013,000
4
Beds
3
Baths
2,253
Sq Ft
$450/Sq Ft
Est. Value
About This Home
This home is located at 117 W 36th St, Bayonne, NJ 07002 and is currently estimated at $1,013,000, approximately $449 per square foot. 117 W 36th St is a home located in Hudson County with nearby schools including Bayonne High School and Yeshiva Gedolah of Bayonne.
Ownership History
Date
Name
Owned For
Owner Type
Purchase Details
Closed on
Feb 21, 2017
Sold by
Gunther Gregory
Bought by
Mccabe Marie
Current Estimated Value
Home Financials for this Owner
Home Financials are based on the most recent Mortgage that was taken out on this home.
Original Mortgage
$265,000
Outstanding Balance
$219,225
Interest Rate
4.17%
Mortgage Type
New Conventional
Estimated Equity
$793,775
Purchase Details
Closed on
Sep 21, 2010
Sold by
Lustig Jeffrey S
Bought by
Gunther Gregory
Home Financials for this Owner
Home Financials are based on the most recent Mortgage that was taken out on this home.
Original Mortgage
$406,524
Interest Rate
4.25%
Mortgage Type
FHA
Purchase Details
Closed on
Jun 7, 2000
Sold by
Savaria Normand P and Savaria Megan K Kennedy
Bought by
Lustig Jeffrey S
Home Financials for this Owner
Home Financials are based on the most recent Mortgage that was taken out on this home.
Original Mortgage
$337,500
Interest Rate
8.24%
Create a Home Valuation Report for This Property
The Home Valuation Report is an in-depth analysis detailing your home's value as well as a comparison with similar homes in the area
Home Values in the Area
Average Home Value in this Area
Purchase History
| Date | Buyer | Sale Price | Title Company |
|---|---|---|---|
| Mccabe Marie | $465,000 | Chicago Title Ins Co | |
| Gunther Gregory | $411,999 | -- | |
| Lustig Jeffrey S | $375,000 | -- |
Source: Public Records
Mortgage History
| Date | Status | Borrower | Loan Amount |
|---|---|---|---|
| Open | Mccabe Marie | $265,000 | |
| Previous Owner | Gunther Gregory | $406,524 | |
| Previous Owner | Lustig Jeffrey S | $337,500 |
Source: Public Records
Tax History Compared to Growth
Tax History
| Year | Tax Paid | Tax Assessment Tax Assessment Total Assessment is a certain percentage of the fair market value that is determined by local assessors to be the total taxable value of land and additions on the property. | Land | Improvement |
|---|---|---|---|---|
| 2025 | $13,505 | $483,000 | $265,600 | $217,400 |
| 2024 | $12,959 | $483,000 | $265,600 | $217,400 |
| 2023 | $12,959 | $483,000 | $265,600 | $217,400 |
| 2022 | $12,717 | $483,000 | $265,600 | $217,400 |
| 2021 | $12,616 | $483,000 | $265,600 | $217,400 |
| 2020 | $13,772 | $536,700 | $265,600 | $271,100 |
| 2019 | $14,602 | $169,200 | $98,700 | $70,500 |
| 2018 | $14,311 | $169,200 | $98,700 | $70,500 |
| 2017 | $13,940 | $169,200 | $98,700 | $70,500 |
| 2016 | $13,426 | $169,200 | $98,700 | $70,500 |
| 2015 | $12,984 | $169,200 | $98,700 | $70,500 |
| 2014 | $12,597 | $169,200 | $98,700 | $70,500 |
Source: Public Records
Map
Nearby Homes
- 31 Avenue B
- 120 W 38th St
- 93 W 35th St
- 122 W 39th St Unit A4
- 83 W 38th St
- 32 Benmore Terrace
- 69 W 39th St
- 158 W 33rd St
- 7 Newark Bay Ct
- 86 W 33rd St Unit 207
- 15 Newark Bay Ct
- 761 Avenue A Unit 21
- 66 W 33rd St
- 759 Avenue A Unit 9
- 46 W 40th St
- 815 John F. Kennedy Blvd
- 13 W 36th St
- 39 W 40th St
- 22 W 34th St Unit 101
- 19 W 39th St
- 121 W 36th St
- 111 W 36th St
- 9 Avenue B Unit 1
- 9 Avenue B
- 15 Avenue B
- 920 Kennedy Blvd
- 17 Avenue B Unit 19
- 120 W 37th St
- 21 Avenue B Unit 23
- 119 W 36th St
- 930 John F. Kennedy Blvd Unit B2
- 930 John F. Kennedy Blvd Unit C-2
- 930 John F. Kennedy Blvd
- 930 John Fitzgerald Kennedy Blvd
- 911 Kennedy Blvd Unit 913
- 803 A St
- 14 Avenue B
- 10 Avenue B Unit 12
- 901 John Fitzgerald Kennedy Blvd
- 911-913 Boulevard