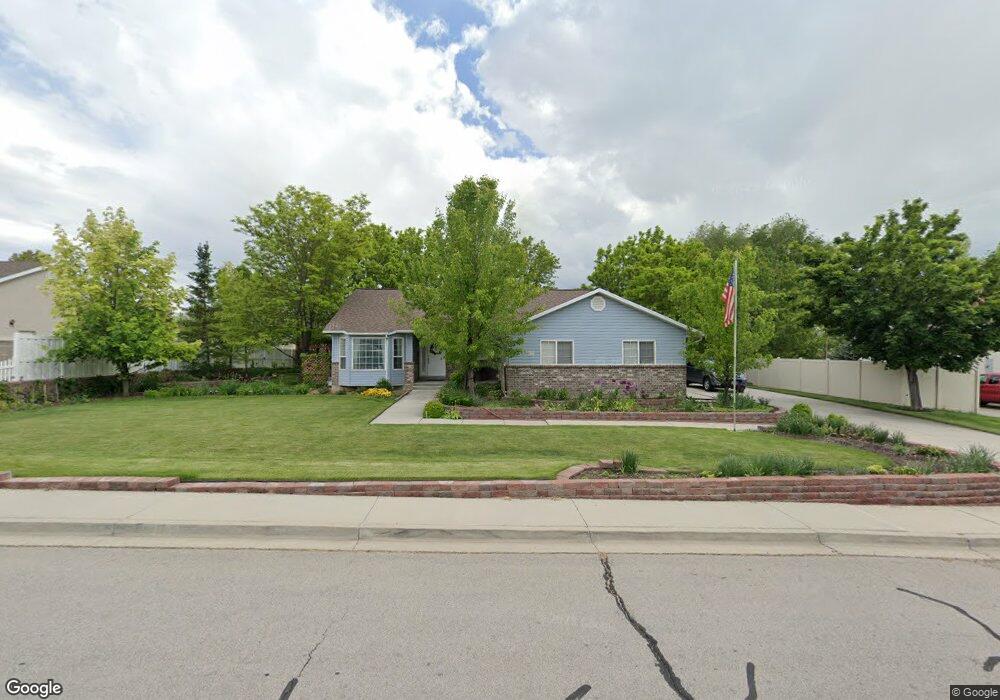
117 W 450 N Lindon, UT 84042
Estimated Value: $666,000 - $809,000
3
Beds
3
Baths
1,848
Sq Ft
$409/Sq Ft
Est. Value
About This Home
This home is located at 117 W 450 N, Lindon, UT 84042 and is currently estimated at $756,361, approximately $409 per square foot. 117 W 450 N is a home located in Utah County with nearby schools including Lindon Elementary School, Oak Canyon Junior High School, and Pleasant Grove High School.
Ownership History
Date
Name
Owned For
Owner Type
Purchase Details
Closed on
Jul 17, 1998
Sold by
Panda Bear Homes Inc
Bought by
Miller Kenneth J and Miller Sharon R
Current Estimated Value
Home Financials for this Owner
Home Financials are based on the most recent Mortgage that was taken out on this home.
Original Mortgage
$202,847
Outstanding Balance
$41,511
Interest Rate
7%
Mortgage Type
VA
Estimated Equity
$714,850
Purchase Details
Closed on
Mar 17, 1998
Sold by
Ron Avi
Bought by
Panda Bear Homes Inc
Create a Home Valuation Report for This Property
The Home Valuation Report is an in-depth analysis detailing your home's value as well as a comparison with similar homes in the area
Home Values in the Area
Average Home Value in this Area
Purchase History
| Date | Buyer | Sale Price | Title Company |
|---|---|---|---|
| Miller Kenneth J | -- | -- | |
| Panda Bear Homes Inc | -- | Provo Land Title |
Source: Public Records
Mortgage History
| Date | Status | Borrower | Loan Amount |
|---|---|---|---|
| Open | Miller Kenneth J | $202,847 |
Source: Public Records
Tax History Compared to Growth
Tax History
| Year | Tax Paid | Tax Assessment Tax Assessment Total Assessment is a certain percentage of the fair market value that is determined by local assessors to be the total taxable value of land and additions on the property. | Land | Improvement |
|---|---|---|---|---|
| 2025 | $3,229 | $409,200 | $441,600 | $302,400 |
| 2024 | $3,229 | $398,090 | $0 | $0 |
| 2023 | $3,087 | $408,760 | $0 | $0 |
| 2022 | $3,132 | $400,675 | $0 | $0 |
| 2021 | $2,643 | $509,800 | $280,300 | $229,500 |
| 2020 | $2,504 | $475,500 | $254,800 | $220,700 |
| 2019 | $2,165 | $428,800 | $208,100 | $220,700 |
| 2018 | $2,160 | $403,300 | $182,600 | $220,700 |
| 2017 | $2,169 | $217,140 | $0 | $0 |
| 2016 | $2,155 | $199,595 | $0 | $0 |
| 2015 | $2,076 | $181,775 | $0 | $0 |
| 2014 | $1,784 | $154,715 | $0 | $0 |
Source: Public Records
Map
Nearby Homes