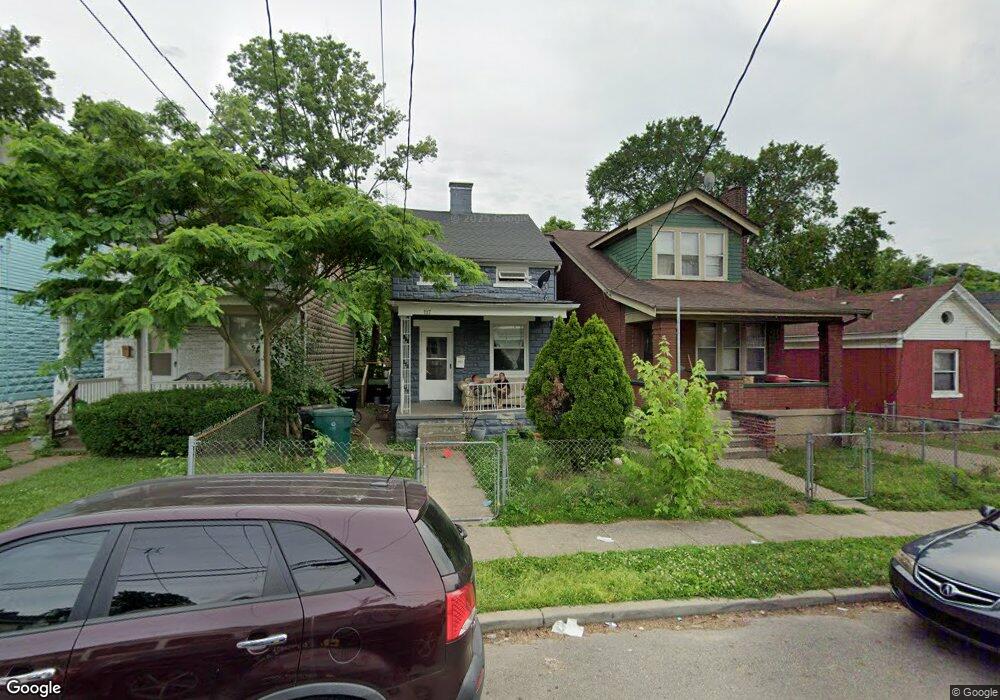
117 W 68th St Cincinnati, OH 45216
Carthage NeighborhoodEstimated Value: $86,000 - $126,800
2
Beds
1
Bath
1,152
Sq Ft
$93/Sq Ft
Est. Value
About This Home
This home is located at 117 W 68th St, Cincinnati, OH 45216 and is currently estimated at $107,600, approximately $93 per square foot. 117 W 68th St is a home located in Hamilton County with nearby schools including Rising Stars at Carthage, Hartwell School, and Shroder High School.
Ownership History
Date
Name
Owned For
Owner Type
Purchase Details
Closed on
Feb 18, 2022
Sold by
Bagialtsalief Christos B
Bought by
Mejia Andreas Vasquez and Hernandez Juana Lemus
Current Estimated Value
Purchase Details
Closed on
Feb 26, 2008
Sold by
The Bank Of New York
Bought by
Bagialtsalief Christos B
Purchase Details
Closed on
Jul 24, 2007
Sold by
Cook Ricky and Cook Michelle
Bought by
The Bank Of New York and Holders Of The Eqcc Asset Backed Certifi
Purchase Details
Closed on
Mar 13, 1998
Sold by
Cawood Jeffrey and Cawood Laura
Bought by
Cook Ricky
Home Financials for this Owner
Home Financials are based on the most recent Mortgage that was taken out on this home.
Original Mortgage
$39,750
Interest Rate
10.7%
Purchase Details
Closed on
Jan 18, 1997
Sold by
Phelan William R and Phelan Nancy Lou
Bought by
Cawood Jeffrey and Cawood Laura
Home Financials for this Owner
Home Financials are based on the most recent Mortgage that was taken out on this home.
Original Mortgage
$30,400
Interest Rate
7.66%
Create a Home Valuation Report for This Property
The Home Valuation Report is an in-depth analysis detailing your home's value as well as a comparison with similar homes in the area
Home Values in the Area
Average Home Value in this Area
Purchase History
| Date | Buyer | Sale Price | Title Company |
|---|---|---|---|
| Mejia Andreas Vasquez | -- | None Listed On Document | |
| Mejia Andreas Vasquez | -- | None Listed On Document | |
| Bagialtsalief Christos B | -- | Lawyers Title Of Cincinnati | |
| The Bank Of New York | $32,000 | None Available | |
| Cook Ricky | $53,000 | Phoenix Land Title Agency In | |
| Cawood Jeffrey | $38,000 | -- |
Source: Public Records
Mortgage History
| Date | Status | Borrower | Loan Amount |
|---|---|---|---|
| Previous Owner | Cook Ricky | $39,750 | |
| Previous Owner | Cawood Jeffrey | $30,400 | |
| Closed | Cook Ricky | $13,250 |
Source: Public Records
Tax History
| Year | Tax Paid | Tax Assessment Tax Assessment Total Assessment is a certain percentage of the fair market value that is determined by local assessors to be the total taxable value of land and additions on the property. | Land | Improvement |
|---|---|---|---|---|
| 2025 | $1,085 | $17,550 | $5,576 | $11,974 |
| 2024 | $1,052 | $17,550 | $5,576 | $11,974 |
| 2023 | $1,076 | $17,550 | $5,576 | $11,974 |
| 2022 | $758 | $10,679 | $2,986 | $7,693 |
| 2021 | $744 | $10,679 | $2,986 | $7,693 |
| 2020 | $746 | $10,679 | $2,986 | $7,693 |
| 2019 | $707 | $9,206 | $2,573 | $6,633 |
| 2018 | $707 | $9,206 | $2,573 | $6,633 |
| 2017 | $681 | $9,206 | $2,573 | $6,633 |
| 2016 | $792 | $10,448 | $3,430 | $7,018 |
| 2015 | $708 | $10,448 | $3,430 | $7,018 |
| 2014 | $712 | $10,448 | $3,430 | $7,018 |
| 2013 | $724 | $10,448 | $3,430 | $7,018 |
Source: Public Records
Map
Nearby Homes
- 206 W 69th St
- 107 W Sixty Fifth St
- 121 64th St
- 6605 Hasler Ln
- 6310 Vine St
- 120 W Seventy Second St
- 524 Maple St
- 1 Spruce St
- 412 Walnut St
- 3 W 73rd St
- 302 Walnut St
- 118 W North Bend Rd
- 215 Walnut St
- 5914 Elmwood Ave
- 14 Township Ave
- 1139 Towanda Terrace
- 0 Township Road 111
- 1117 W Seymour Ave
- 1418 Lakeland Ave
- 1522 Kenova Ave
- 119 W 68th St
- 115 W 68th St
- 113 W 68th St
- 113 W 68th St
- 121 W 68th St
- 123 W 68th St
- 0 W Sixty Eighth St Unit 1513508
- 109 W 68th St
- 6659 Fairpark Ave
- 125 W 68th St
- 125 W 68th St
- 107 W 68th St
- 127 W 68th St
- 105 W 68th St
- 6716 Van Kirk Ave
- 116 W 68th St
- 110 W 68th St
- 120 W 68th St
- 6714 Van Kirk Ave
- 129 W 68th St
Your Personal Tour Guide
Ask me questions while you tour the home.