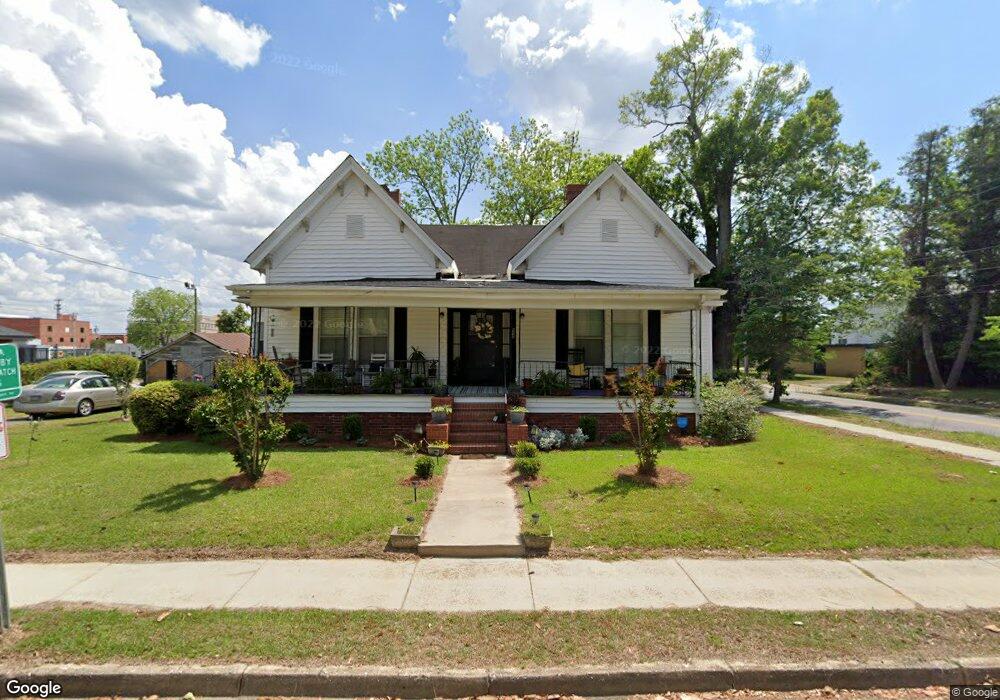
117 W 8th St Lumberton, NC 28358
Estimated Value: $172,000 - $185,000
3
Beds
2
Baths
2,048
Sq Ft
$87/Sq Ft
Est. Value
About This Home
This home is located at 117 W 8th St, Lumberton, NC 28358 and is currently estimated at $177,386, approximately $86 per square foot. 117 W 8th St is a home located in Robeson County with nearby schools including Tanglewood Elementary School, Parkton Elementary School, and L. Gilbert Carroll Middle School.
Ownership History
Date
Name
Owned For
Owner Type
Purchase Details
Closed on
Nov 30, 2017
Sold by
Rhodes Shirrel Lynn
Bought by
Bryant Bernice
Current Estimated Value
Home Financials for this Owner
Home Financials are based on the most recent Mortgage that was taken out on this home.
Original Mortgage
$46,805
Outstanding Balance
$39,344
Interest Rate
3.88%
Mortgage Type
New Conventional
Estimated Equity
$138,042
Purchase Details
Closed on
Jan 1, 1989
Bought by
Rhodes Bonnie I C%O Jeff Rhodes
Purchase Details
Closed on
Jan 1, 1985
Bought by
Rhodes Bonnie I C%O Jeff Rhodes
Purchase Details
Closed on
Jan 1, 1968
Bought by
Rhodes Bonnie I C%O Jeff Rhodes
Purchase Details
Closed on
Jan 1, 1950
Sold by
Inman Leslie Martin
Bought by
Rhodes Bonnie I C%O Jeff Rhodes
Create a Home Valuation Report for This Property
The Home Valuation Report is an in-depth analysis detailing your home's value as well as a comparison with similar homes in the area
Home Values in the Area
Average Home Value in this Area
Purchase History
| Date | Buyer | Sale Price | Title Company |
|---|---|---|---|
| Bryant Bernice | $46,000 | None Available | |
| Rhodes Bonnie I C%O Jeff Rhodes | -- | -- | |
| Rhodes Bonnie I C%O Jeff Rhodes | -- | -- | |
| Rhodes Bonnie I C%O Jeff Rhodes | -- | -- | |
| Rhodes Bonnie I C%O Jeff Rhodes | -- | -- |
Source: Public Records
Mortgage History
| Date | Status | Borrower | Loan Amount |
|---|---|---|---|
| Open | Bryant Bernice | $46,805 |
Source: Public Records
Tax History Compared to Growth
Tax History
| Year | Tax Paid | Tax Assessment Tax Assessment Total Assessment is a certain percentage of the fair market value that is determined by local assessors to be the total taxable value of land and additions on the property. | Land | Improvement |
|---|---|---|---|---|
| 2025 | $1,170 | $145,300 | $33,000 | $112,300 |
| 2024 | $1,165 | $145,300 | $33,000 | $112,300 |
| 2023 | $901 | $109,600 | $30,000 | $79,600 |
| 2022 | $901 | $109,600 | $30,000 | $79,600 |
| 2021 | $901 | $109,600 | $30,000 | $79,600 |
| 2020 | $879 | $88,500 | $30,000 | $58,500 |
| 2018 | $897 | $92,500 | $40,000 | $52,500 |
| 2017 | $772 | $92,500 | $40,000 | $52,500 |
| 2016 | $772 | $92,500 | $40,000 | $52,500 |
| 2015 | $772 | $92,500 | $40,000 | $52,500 |
| 2014 | $772 | $92,500 | $40,000 | $52,500 |
Source: Public Records
Map
Nearby Homes