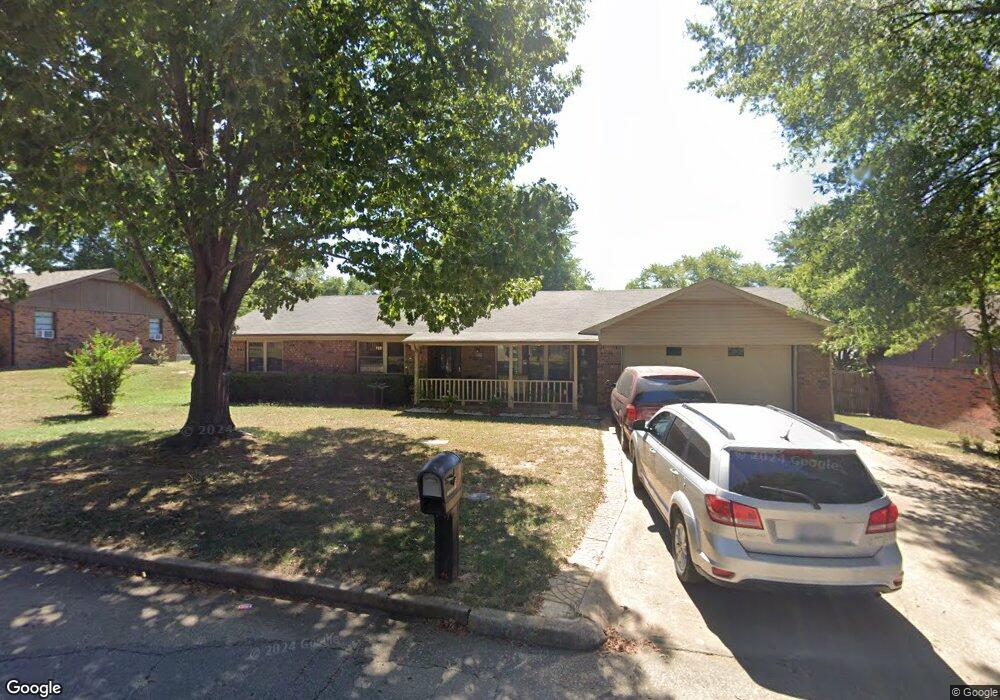
117 W 9th St S Claremore, OK 74017
Estimated Value: $152,000 - $178,000
3
Beds
2
Baths
1,087
Sq Ft
$152/Sq Ft
Est. Value
About This Home
This home is located at 117 W 9th St S, Claremore, OK 74017 and is currently estimated at $165,386, approximately $152 per square foot. 117 W 9th St S is a home located in Rogers County with nearby schools including Claremont Elementary School, Will Rogers Junior High School, and Claremore High School.
Ownership History
Date
Name
Owned For
Owner Type
Purchase Details
Closed on
Dec 13, 2019
Sold by
Brown Elna
Bought by
Brown Tony and Brown Lana
Current Estimated Value
Purchase Details
Closed on
Mar 7, 2017
Sold by
Brown Elna
Bought by
Brown Tony and Brown Lana
Purchase Details
Closed on
Jan 27, 2017
Sold by
Brown Harry W and Brown Elna
Bought by
Brown Elna
Create a Home Valuation Report for This Property
The Home Valuation Report is an in-depth analysis detailing your home's value as well as a comparison with similar homes in the area
Home Values in the Area
Average Home Value in this Area
Purchase History
| Date | Buyer | Sale Price | Title Company |
|---|---|---|---|
| Brown Tony | -- | None Available | |
| Brown Tony | -- | None Available | |
| Brown Elna | -- | None Available |
Source: Public Records
Tax History Compared to Growth
Tax History
| Year | Tax Paid | Tax Assessment Tax Assessment Total Assessment is a certain percentage of the fair market value that is determined by local assessors to be the total taxable value of land and additions on the property. | Land | Improvement |
|---|---|---|---|---|
| 2025 | $563 | $7,093 | $2,929 | $4,164 |
| 2024 | $563 | $7,092 | $2,653 | $4,439 |
| 2023 | $563 | $7,092 | $2,085 | $5,007 |
| 2022 | $564 | $7,092 | $1,188 | $5,904 |
| 2021 | $520 | $7,093 | $1,183 | $5,910 |
| 2020 | $612 | $7,019 | $1,172 | $5,847 |
| 2019 | $497 | $6,367 | $1,075 | $5,292 |
| 2018 | $496 | $6,367 | $1,032 | $5,335 |
| 2017 | $493 | $6,367 | $1,040 | $5,327 |
| 2016 | $504 | $6,367 | $1,066 | $5,301 |
| 2015 | $498 | $6,367 | $1,454 | $4,913 |
| 2014 | $498 | $6,367 | $1,404 | $4,963 |
Source: Public Records
Map
Nearby Homes
- 121 W 9th Place S
- 203 W 9th St S
- 809 S Muskogee Ave
- 16111 Oklahoma 88
- 507 S Maryland Ave
- 321 E Patti Page Blvd
- 402 E Patti Page Blvd
- 417 E Will Rogers Blvd
- 317 E 4th St
- 21755 Country Ridge Ln
- 202 W 4th St
- 1410 W Danny St
- 522 E 6th St
- 520 E 6th St
- 221 N Dorothy Ave
- RC Fenway Plan at Red Plains
- RC Wright Plan at Red Plains
- RC Foster II Plan at Red Plains
- RC Armstrong II Plan at Red Plains
- RC Davenport Plan at Red Plains
- 115 W 9th St S
- 119 W 9th St S
- 903 S Chickasaw Ave
- null Chickasaw Ave
- 120 W 9th St S
- 121 W 9th St S
- 118 W 9th St S
- 122 W 9th St S
- 905 S Chickasaw Ave
- 116 W 9th St S
- 96 W 9th Place S
- 110 E 9th St S
- 104 E 9th St S
- 103 E 9th St S
- 108 E 9th St S
- 904 S Chickasaw Ave
- 124 W 9th St S
- 102 E 9th St S
- 906 S Chickasaw Ave
- 901 W 9th Place S