Estimated Value: $468,000 - $507,611
2
Beds
1
Bath
972
Sq Ft
$503/Sq Ft
Est. Value
About This Home
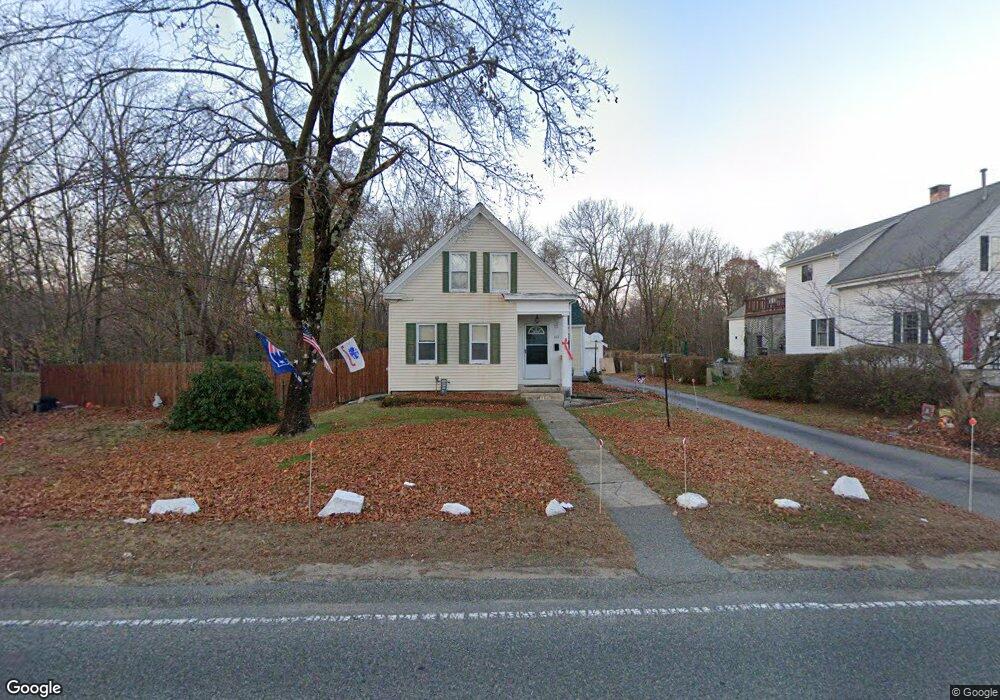
This home is located at 117 W High St, Avon, MA 02322 and is currently estimated at $489,153, approximately $503 per square foot. 117 W High St is a home located in Norfolk County with nearby schools including Ralph D. Butler Elementary School, Avon Middle/High School, and Lighthouse Baptist Christian Academy.
Ownership History
Date
Name
Owned For
Owner Type
Purchase Details
Closed on
Mar 26, 2019
Sold by
Hurley Thomas P and Lawson Janet A
Bought by
Lawson Janet A
Current Estimated Value
Purchase Details
Closed on
Feb 21, 1997
Sold by
Bostic-Fitzgerald Mary
Bought by
Hurley Thomas P and Hurley Janet A
Home Financials for this Owner
Home Financials are based on the most recent Mortgage that was taken out on this home.
Original Mortgage
$96,000
Interest Rate
7.8%
Mortgage Type
Purchase Money Mortgage
Purchase Details
Closed on
Aug 30, 1996
Sold by
Anderson Robert T
Bought by
Fitzgerald Mary Bostic
Home Financials for this Owner
Home Financials are based on the most recent Mortgage that was taken out on this home.
Original Mortgage
$48,000
Interest Rate
8.18%
Mortgage Type
Purchase Money Mortgage
Create a Home Valuation Report for This Property
The Home Valuation Report is an in-depth analysis detailing your home's value as well as a comparison with similar homes in the area
Home Values in the Area
Average Home Value in this Area
Purchase History
| Date | Buyer | Sale Price | Title Company |
|---|---|---|---|
| Lawson Janet A | -- | -- | |
| Hurley Thomas P | $120,000 | -- | |
| Fitzgerald Mary Bostic | $60,000 | -- |
Source: Public Records
Mortgage History
| Date | Status | Borrower | Loan Amount |
|---|---|---|---|
| Previous Owner | Fitzgerald Mary Bostic | $84,500 | |
| Previous Owner | Fitzgerald Mary Bostic | $96,000 | |
| Previous Owner | Fitzgerald Mary Bostic | $48,000 |
Source: Public Records
Tax History Compared to Growth
Tax History
| Year | Tax Paid | Tax Assessment Tax Assessment Total Assessment is a certain percentage of the fair market value that is determined by local assessors to be the total taxable value of land and additions on the property. | Land | Improvement |
|---|---|---|---|---|
| 2025 | $51 | $383,900 | $191,500 | $192,400 |
| 2024 | $4,868 | $347,000 | $181,500 | $165,500 |
| 2023 | $4,726 | $347,000 | $181,500 | $165,500 |
| 2022 | $4,715 | $298,200 | $151,300 | $146,900 |
| 2021 | $4,460 | $265,800 | $137,400 | $128,400 |
| 2020 | $4,903 | $277,000 | $134,700 | $142,300 |
| 2019 | $4,688 | $260,600 | $134,700 | $125,900 |
| 2018 | $4,834 | $260,600 | $134,700 | $125,900 |
| 2017 | $4,056 | $234,700 | $134,700 | $100,000 |
| 2016 | $4,052 | $236,800 | $134,800 | $102,000 |
| 2015 | $3,480 | $212,600 | $122,600 | $90,000 |
Source: Public Records
Map
Nearby Homes