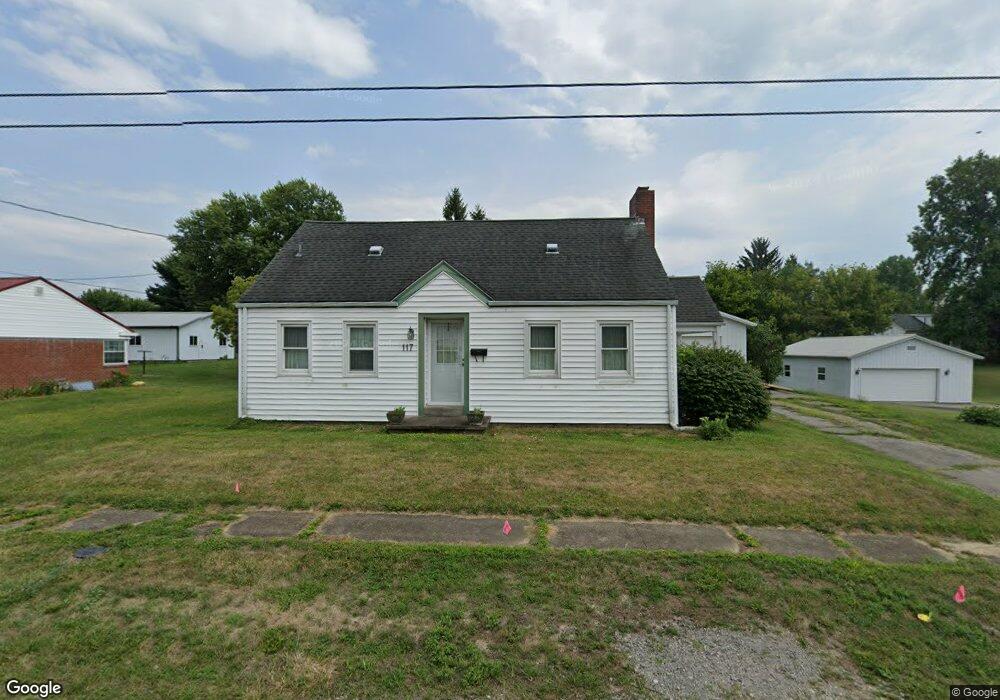
117 W Johns St Blanchester, OH 45107
Estimated Value: $210,144 - $324,000
2
Beds
2
Baths
1,208
Sq Ft
$206/Sq Ft
Est. Value
About This Home
This home is located at 117 W Johns St, Blanchester, OH 45107 and is currently estimated at $249,036, approximately $206 per square foot. 117 W Johns St is a home located in Clinton County with nearby schools including Putman Elementary School, Blanchester Middle School, and Blanchester High School.
Ownership History
Date
Name
Owned For
Owner Type
Purchase Details
Closed on
Jan 5, 1994
Bought by
Coleman Robert E
Current Estimated Value
Create a Home Valuation Report for This Property
The Home Valuation Report is an in-depth analysis detailing your home's value as well as a comparison with similar homes in the area
Home Values in the Area
Average Home Value in this Area
Purchase History
| Date | Buyer | Sale Price | Title Company |
|---|---|---|---|
| Coleman Robert E | -- | -- |
Source: Public Records
Tax History
| Year | Tax Paid | Tax Assessment Tax Assessment Total Assessment is a certain percentage of the fair market value that is determined by local assessors to be the total taxable value of land and additions on the property. | Land | Improvement |
|---|---|---|---|---|
| 2024 | $1,988 | $56,390 | $3,750 | $52,640 |
| 2023 | $2,110 | $56,390 | $3,750 | $52,640 |
| 2022 | $1,536 | $37,160 | $2,840 | $34,320 |
| 2021 | $1,610 | $37,160 | $2,840 | $34,320 |
| 2020 | $1,605 | $37,160 | $2,840 | $34,320 |
| 2019 | $1,249 | $28,030 | $2,850 | $25,180 |
| 2018 | $1,254 | $28,030 | $2,850 | $25,180 |
| 2017 | $1,228 | $28,030 | $2,850 | $25,180 |
| 2016 | $1,216 | $29,090 | $2,840 | $26,250 |
| 2015 | $858 | $20,550 | $2,840 | $17,710 |
| 2013 | $968 | $22,480 | $2,840 | $19,640 |
Source: Public Records
Map
Nearby Homes
- 112 W Baldwin St
- 203 E Main St
- 1 Middleboro Rd
- 502 Railroad St
- 305 E Main St
- 117 Pansy Pike
- 308 Lazenby St
- 157 Pansy Pike
- 308 S Broadway St
- 501 E Johns St
- 143 W Fancy St
- 503 S Broadway St
- 507 Bourbon St
- 9 Pansy Pike
- 11 Pansy Pike
- 12 Pansy Pike
- 10 Pansy Pike
- 501 S Wright St
- 0 Ohio 123 Unit 11 938995
- 0 Ohio 123 Unit 1848086
- 201 W Johns St
- 111 W Johns St
- 114 W Johns St
- 114 W Baldwin St
- 120 W Johns St
- 110 W Johns St
- 110 W Johns St
- 110 W Baldwin St
- 202 W Baldwin St
- 313 N Broadway St
- 309 N Broadway St
- 213 W Johns St
- 106 W Johns St
- 305 N Broadway St
- 317 N Broadway St
- 206 W Baldwin St
- 301 N Broadway St
- 200 W Johns St
- 401 N Broadway St
- 403 N Broadway St
Your Personal Tour Guide
Ask me questions while you tour the home.