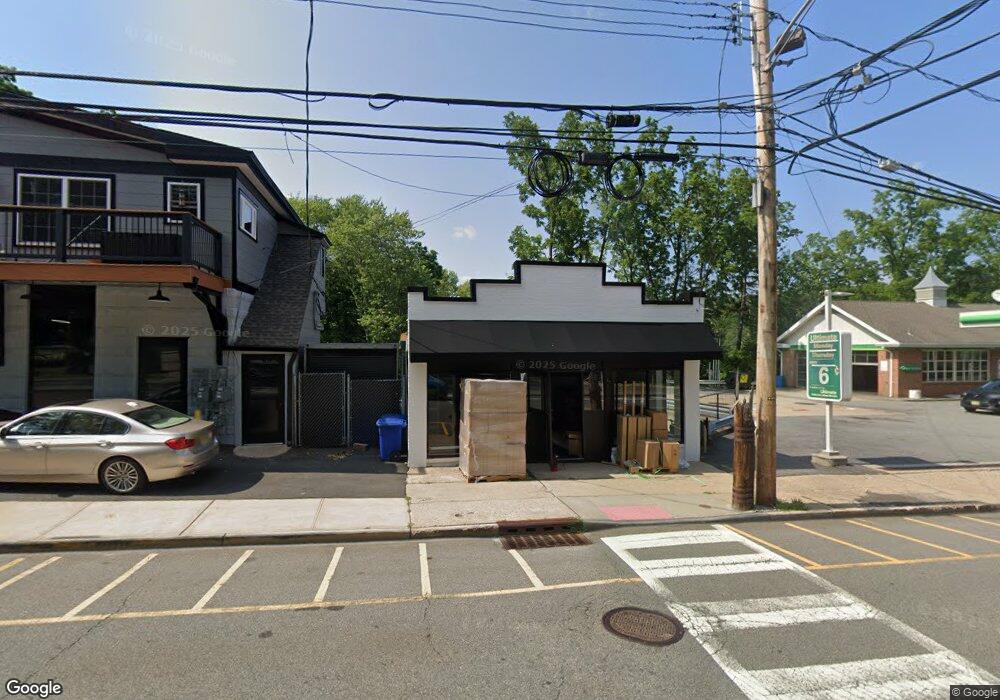
117 W Main St Boonton, NJ 07005
Estimated Value: $294,187 - $297,000
--
Bed
--
Bath
1,624
Sq Ft
$182/Sq Ft
Est. Value
About This Home
This home is located at 117 W Main St, Boonton, NJ 07005 and is currently estimated at $295,594, approximately $182 per square foot. 117 W Main St is a home with nearby schools including School Street Elementary School, John Hill Elementary School, and Boonton High School.
Ownership History
Date
Name
Owned For
Owner Type
Purchase Details
Closed on
Mar 30, 2023
Sold by
Herbison-Bentley Maryjane
Bought by
Automotive Specialists Llc
Current Estimated Value
Purchase Details
Closed on
Sep 25, 2008
Sold by
Saint Clares Hospital Inc
Bought by
Herbison Bentley Maryjane
Home Financials for this Owner
Home Financials are based on the most recent Mortgage that was taken out on this home.
Original Mortgage
$65,000
Interest Rate
6.03%
Mortgage Type
Commercial
Create a Home Valuation Report for This Property
The Home Valuation Report is an in-depth analysis detailing your home's value as well as a comparison with similar homes in the area
Home Values in the Area
Average Home Value in this Area
Purchase History
| Date | Buyer | Sale Price | Title Company |
|---|---|---|---|
| Automotive Specialists Llc | $240,000 | Property Title Group | |
| Automotive Specialists Llc | $240,000 | Property Title Group | |
| Herbison Bentley Maryjane | $152,000 | New Jersey Title Ins Co |
Source: Public Records
Mortgage History
| Date | Status | Borrower | Loan Amount |
|---|---|---|---|
| Previous Owner | Herbison Bentley Maryjane | $65,000 |
Source: Public Records
Tax History Compared to Growth
Tax History
| Year | Tax Paid | Tax Assessment Tax Assessment Total Assessment is a certain percentage of the fair market value that is determined by local assessors to be the total taxable value of land and additions on the property. | Land | Improvement |
|---|---|---|---|---|
| 2025 | $4,833 | $143,000 | $76,500 | $66,500 |
| 2024 | $4,706 | $143,000 | $76,500 | $66,500 |
| 2023 | $4,706 | $143,000 | $76,500 | $66,500 |
| 2022 | $4,460 | $143,000 | $76,500 | $66,500 |
| 2021 | $4,460 | $143,000 | $76,500 | $66,500 |
| 2020 | $4,276 | $143,000 | $76,500 | $66,500 |
| 2019 | $4,331 | $143,000 | $76,500 | $66,500 |
| 2018 | $4,217 | $143,000 | $76,500 | $66,500 |
| 2017 | $4,041 | $143,000 | $76,500 | $66,500 |
| 2016 | $3,935 | $143,000 | $76,500 | $66,500 |
| 2015 | $3,871 | $143,000 | $76,500 | $66,500 |
| 2014 | $3,785 | $143,000 | $76,500 | $66,500 |
Source: Public Records
Map
Nearby Homes