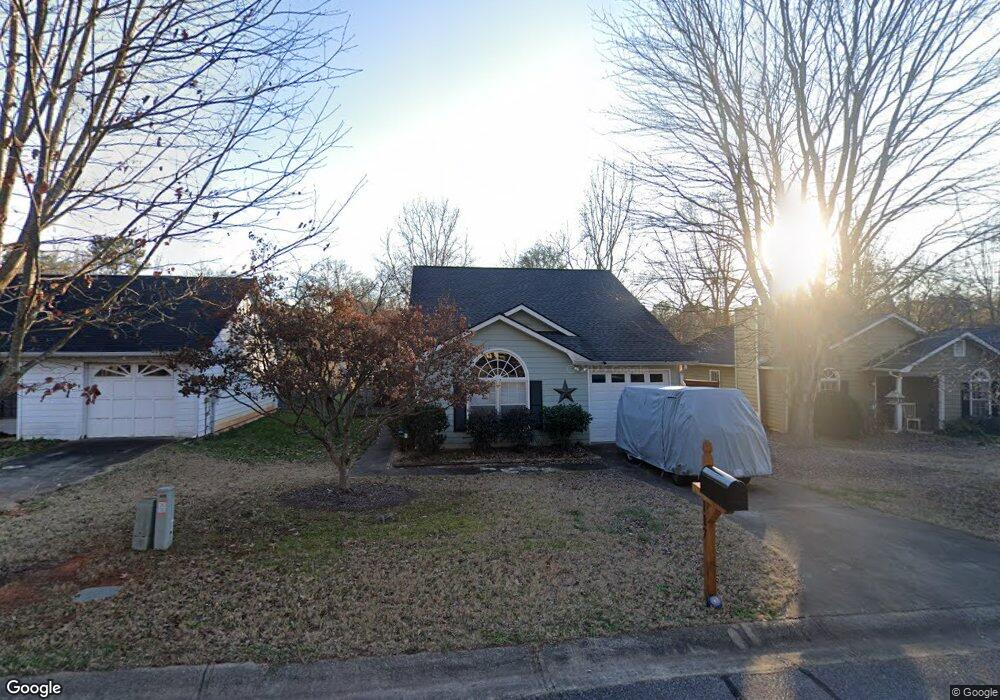
117 Wakefield Trace Athens, GA 30605
Estimated Value: $277,968 - $294,000
3
Beds
2
Baths
1,187
Sq Ft
$241/Sq Ft
Est. Value
About This Home
This home is located at 117 Wakefield Trace, Athens, GA 30605 and is currently estimated at $285,992, approximately $240 per square foot. 117 Wakefield Trace is a home located in Clarke County with nearby schools including Barnett Shoals Elementary School, Hilsman Middle School, and Cedar Shoals High School.
Ownership History
Date
Name
Owned For
Owner Type
Purchase Details
Closed on
Sep 24, 2009
Sold by
Deneke Mary Elizabeth
Bought by
Karneboge Kevin P
Current Estimated Value
Purchase Details
Closed on
Mar 31, 2005
Sold by
Karneboge Kevin P
Bought by
Deneke Mary Elizabeth
Purchase Details
Closed on
Mar 28, 2005
Sold by
Wease Donald Ray
Bought by
Karneboge Kevin P
Purchase Details
Closed on
Jun 30, 1999
Sold by
Olsen James Arthur
Bought by
Wease Donald Ray and Teresa Michel
Purchase Details
Closed on
Oct 31, 1997
Sold by
Masters Larry Keith Jana L Masters
Bought by
Olsen James Arthur
Purchase Details
Closed on
Aug 17, 1993
Sold by
Buckston Properties Ltd
Bought by
Masters Larry Keith Jana L Masters
Purchase Details
Closed on
Dec 11, 1992
Sold by
Crane Properties Inc
Bought by
Buckston Properties Ltd
Create a Home Valuation Report for This Property
The Home Valuation Report is an in-depth analysis detailing your home's value as well as a comparison with similar homes in the area
Home Values in the Area
Average Home Value in this Area
Purchase History
| Date | Buyer | Sale Price | Title Company |
|---|---|---|---|
| Karneboge Kevin P | -- | -- | |
| Deneke Mary Elizabeth | -- | -- | |
| Karneboge Kevin P | $116,500 | -- | |
| Wease Donald Ray | $93,000 | -- | |
| Olsen James Arthur | $81,800 | -- | |
| Masters Larry Keith Jana L Masters | $64,900 | -- | |
| Buckston Properties Ltd | -- | -- |
Source: Public Records
Tax History Compared to Growth
Tax History
| Year | Tax Paid | Tax Assessment Tax Assessment Total Assessment is a certain percentage of the fair market value that is determined by local assessors to be the total taxable value of land and additions on the property. | Land | Improvement |
|---|---|---|---|---|
| 2025 | $2,685 | $103,749 | $12,000 | $91,749 |
| 2024 | $2,685 | $100,268 | $12,000 | $88,268 |
| 2023 | $1,869 | $94,792 | $12,000 | $82,792 |
| 2022 | $2,209 | $79,234 | $10,400 | $68,834 |
| 2021 | $1,764 | $62,343 | $8,800 | $53,543 |
| 2020 | $1,633 | $58,446 | $8,800 | $49,646 |
| 2019 | $1,421 | $51,861 | $8,800 | $43,061 |
| 2018 | $1,368 | $50,287 | $8,800 | $41,487 |
| 2017 | $1,234 | $46,340 | $8,800 | $37,540 |
| 2016 | $1,047 | $40,845 | $8,800 | $32,045 |
| 2015 | $1,018 | $39,940 | $8,800 | $31,140 |
| 2014 | $1,001 | $39,367 | $8,800 | $30,567 |
Source: Public Records
Map
Nearby Homes
- 125 Wakefield Trace
- 109 Wakefield Trace
- 133 Wakefield Trace
- 116 Warren Way
- 108 Warren Way
- 141 Wakefield Trace
- 124 Warren Way
- 100 Warren Way
- 110 Wakefield Trace
- 118 Wakefield Trace
- 102 Wakefield Trace
- 132 Warren Way
- 126 Wakefield Trace
- 149 Wakefield Trace
- 101 Lauren Ln
- 132 Wakefield Trace
- 140 Warren Way
- 103 Lauren Ln
- 0 Armour Ct Unit 7583717
- 140 Wakefield Trace