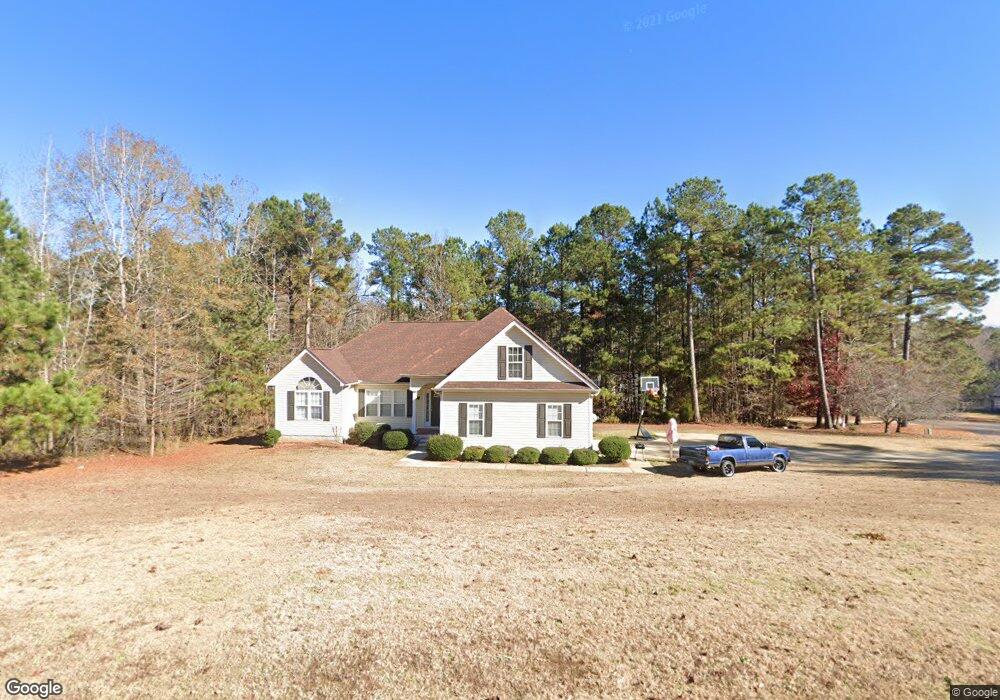
117 Waters Edge Dr Lagrange, GA 30240
Estimated Value: $279,000 - $312,000
3
Beds
2
Baths
1,773
Sq Ft
$166/Sq Ft
Est. Value
About This Home
This home is located at 117 Waters Edge Dr, Lagrange, GA 30240 and is currently estimated at $294,343, approximately $166 per square foot. 117 Waters Edge Dr is a home located in Troup County with nearby schools including Long Cane Elementary School, Berta Weathersbee Elementary School, and West Point Elementary School.
Ownership History
Date
Name
Owned For
Owner Type
Purchase Details
Closed on
Sep 13, 2018
Sold by
Aspinwall Renae
Bought by
Williams Jequetta Lasha
Current Estimated Value
Home Financials for this Owner
Home Financials are based on the most recent Mortgage that was taken out on this home.
Original Mortgage
$153,075
Outstanding Balance
$134,534
Interest Rate
5.25%
Mortgage Type
FHA
Estimated Equity
$159,809
Purchase Details
Closed on
Feb 5, 2018
Sold by
Cooper Wesley Robert
Bought by
Aspinwall Renae
Home Financials for this Owner
Home Financials are based on the most recent Mortgage that was taken out on this home.
Original Mortgage
$100,000
Interest Rate
3.95%
Mortgage Type
Purchase Money Mortgage
Purchase Details
Closed on
Apr 10, 2003
Sold by
C & W Development Inc
Bought by
Cooper Wesley Robert
Purchase Details
Closed on
Aug 22, 2000
Bought by
C & W Development Inc
Create a Home Valuation Report for This Property
The Home Valuation Report is an in-depth analysis detailing your home's value as well as a comparison with similar homes in the area
Purchase History
| Date | Buyer | Sale Price | Title Company |
|---|---|---|---|
| Williams Jequetta Lasha | $155,900 | -- | |
| Aspinwall Renae | $106,827 | -- | |
| Cooper Wesley Robert | $19,400 | -- | |
| C & W Development Inc | -- | -- |
Source: Public Records
Mortgage History
| Date | Status | Borrower | Loan Amount |
|---|---|---|---|
| Open | Williams Jequetta Lasha | $153,075 | |
| Previous Owner | Aspinwall Renae | $100,000 |
Source: Public Records
Tax History
| Year | Tax Paid | Tax Assessment Tax Assessment Total Assessment is a certain percentage of the fair market value that is determined by local assessors to be the total taxable value of land and additions on the property. | Land | Improvement |
|---|---|---|---|---|
| 2025 | $2,897 | $113,440 | $14,000 | $99,440 |
| 2024 | $2,639 | $98,760 | $14,000 | $84,760 |
| 2023 | $2,457 | $92,080 | $10,000 | $82,080 |
| 2022 | $1,933 | $71,240 | $10,000 | $61,240 |
| 2021 | $2,039 | $69,600 | $10,000 | $59,600 |
| 2020 | $1,979 | $67,600 | $8,000 | $59,600 |
| 2019 | $1,893 | $62,760 | $8,000 | $54,760 |
| 2018 | $1,751 | $60,040 | $8,000 | $52,040 |
| 2017 | $1,751 | $60,040 | $8,000 | $52,040 |
| 2016 | $1,702 | $58,409 | $8,000 | $50,409 |
| 2015 | $1,741 | $59,614 | $10,000 | $49,614 |
| 2014 | $1,533 | $52,639 | $7,000 | $45,639 |
| 2013 | -- | $48,805 | $7,000 | $41,805 |
Source: Public Records
Map
Nearby Homes
- 107 Waters Edge Dr
- 107 Sweetwater Ct
- 102 Bridgewater Dr
- 5714 W Point Rd
- 104 Hidden Springs Dr
- 124 Lincoln Ln
- 640 Hudson Rd
- 119 Plymouth Dr
- 104 Landings Way
- 311 Cumberland Dr
- 106 Landings Way
- 102 Landings Way
- 101 Ivy Springs Dr
- 101 Riverbluff Dr
- 113 Colonial Ct Unit 100
- 266 Glass Bridge Rd
- 109 Riverbluff Dr
- 201 Lakeview Ct
- 474 Newton Rd
- 40 River Point Dr
- 119 Waters Edge Dr
- 102 Waterford Cir
- 118 Waters Edge Dr
- 101 Waterford Cir
- 120 Waters Edge Dr
- 121 Waters Edge Dr Unit 19
- 104 Waterford Cir
- 103 Waterford Cir
- 116 Waters Edge Dr
- 124 Waters Edge Dr
- 122 Waters Edge Dr
- 113 Waters Edge Dr
- 114 Waters Edge Dr
- 112 Waters Edge Dr
- 104 Sweetwater Dr
- 103 Lake Side Dr
- 111 Waters Edge Dr
- 106 Sweetwater Dr
- 102 Sweetwater Dr
- 102 Lake Side Dr
Your Personal Tour Guide
Ask me questions while you tour the home.