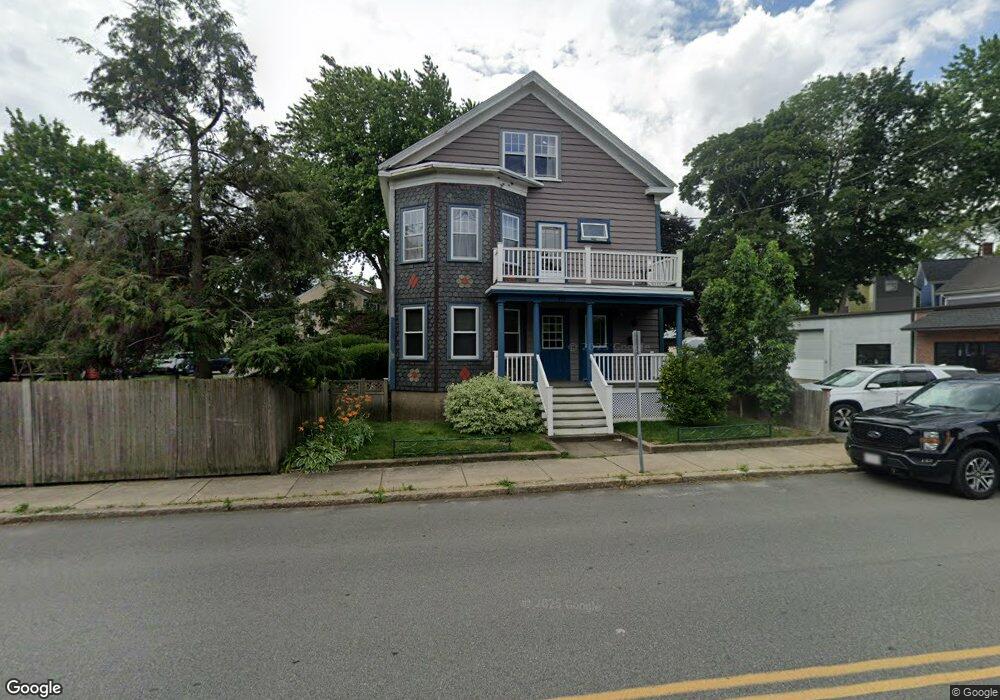
117 Webb St Salem, MA 01970
Salem Common NeighborhoodEstimated Value: $1,019,727 - $1,114,000
5
Beds
3
Baths
3,323
Sq Ft
$322/Sq Ft
Est. Value
About This Home
This home is located at 117 Webb St, Salem, MA 01970 and is currently estimated at $1,068,432, approximately $321 per square foot. 117 Webb St is a home located in Essex County with nearby schools including Carlton Elementary School, Saltonstall School, and Bates Elementary School.
Ownership History
Date
Name
Owned For
Owner Type
Purchase Details
Closed on
Aug 15, 2022
Sold by
Marshall Ann E
Bought by
Marshall Rt
Current Estimated Value
Purchase Details
Closed on
Nov 30, 2007
Sold by
Marshall Ann E and Marshall James H
Bought by
Sousa Ann E
Home Financials for this Owner
Home Financials are based on the most recent Mortgage that was taken out on this home.
Original Mortgage
$25,000
Interest Rate
6.3%
Purchase Details
Closed on
Jan 29, 2003
Sold by
Marshall James H
Bought by
Marshall James H
Purchase Details
Closed on
Jan 31, 2001
Sold by
Godjikian Paul D
Bought by
Marshall James H
Create a Home Valuation Report for This Property
The Home Valuation Report is an in-depth analysis detailing your home's value as well as a comparison with similar homes in the area
Home Values in the Area
Average Home Value in this Area
Purchase History
| Date | Buyer | Sale Price | Title Company |
|---|---|---|---|
| Marshall Rt | -- | None Available | |
| Sousa Ann E | -- | -- | |
| Marshall James H | -- | -- | |
| Marshall James H | $349,900 | -- |
Source: Public Records
Mortgage History
| Date | Status | Borrower | Loan Amount |
|---|---|---|---|
| Previous Owner | Marshall James H | $239,500 | |
| Previous Owner | Marshall James H | $25,000 | |
| Previous Owner | Marshall James H | $236,000 |
Source: Public Records
Tax History
| Year | Tax Paid | Tax Assessment Tax Assessment Total Assessment is a certain percentage of the fair market value that is determined by local assessors to be the total taxable value of land and additions on the property. | Land | Improvement |
|---|---|---|---|---|
| 2025 | $9,611 | $847,500 | $217,900 | $629,600 |
| 2024 | $8,975 | $772,400 | $217,900 | $554,500 |
| 2023 | $8,666 | $692,700 | $199,500 | $493,200 |
| 2022 | $8,643 | $652,300 | $192,100 | $460,200 |
| 2021 | $8,299 | $601,400 | $181,000 | $420,400 |
| 2020 | $7,764 | $537,300 | $162,500 | $374,800 |
| 2019 | $7,591 | $502,700 | $147,800 | $354,900 |
| 2018 | $6,961 | $452,600 | $137,400 | $315,200 |
| 2017 | $6,734 | $424,600 | $129,300 | $295,300 |
| 2016 | $6,271 | $400,200 | $104,900 | $295,300 |
| 2015 | $6,254 | $381,100 | $104,900 | $276,200 |
Source: Public Records
Map
Nearby Homes
- 21 Emerton St Unit 2
- 31 N Washington Square Unit 3
- 16 Williams St
- 7 Forrester St
- 11 Williams St Unit 2
- 40 Essex St Unit 2
- 17 Webb St Unit 1
- 8 Webb St
- 69 Essex St Unit 2
- 7 Curtis St Unit 1
- 16 Bentley St Unit 3
- 10.5 Herbert St Unit 21
- 131 Derby St Unit 3F
- 16 Franklin St Unit 2403
- 16 Franklin St Unit 1303
- 16 Franklin St Unit 2202
- 11 Church St Unit 203
- 11 Church St Unit 702
- 11 Church St Unit 703
- 65 Washington St Unit 512
- 4 Webster St
- 5 Webster St
- 57 Webster St
- 11 Pleasant St
- 3 Webster St Unit 2
- 3 Webster St Unit 4
- 3 Webster St Unit 3
- 3 Webster St
- 15 Pleasant St
- 121 Webb St
- 101 Webb St
- 101 Webb St
- 1 Webster St
- 28 Arbella St
- 9 Pleasant St
- 24 Arbella St
- 30 Arbella St
- 30 Arbella St Unit 1
- 7 1/2 Pleasant St
- 26 Arbella St
Your Personal Tour Guide
Ask me questions while you tour the home.