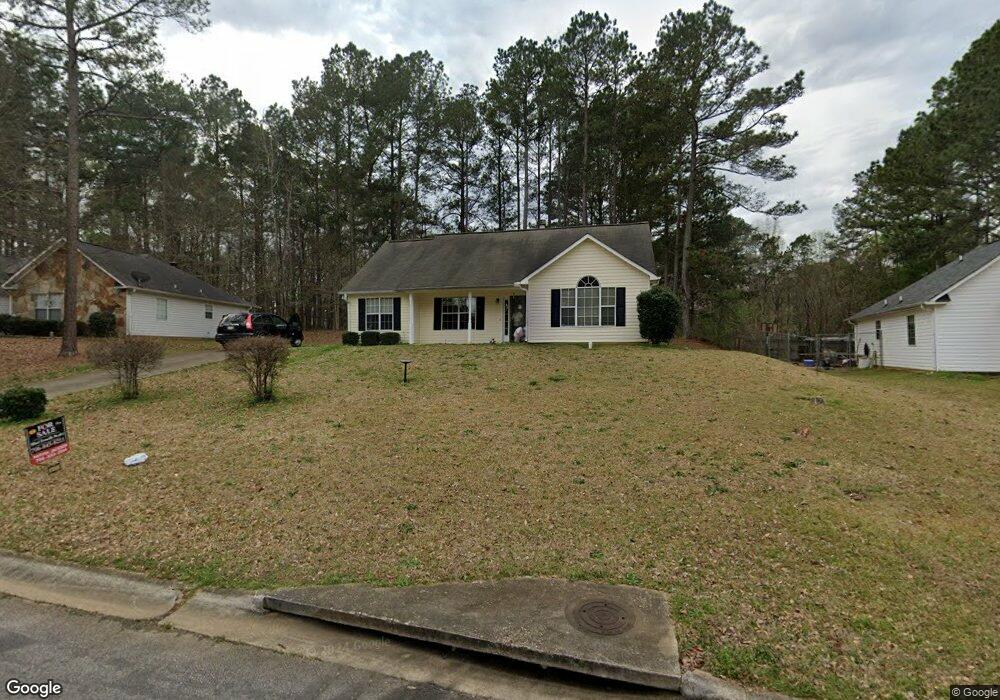
117 Woodridge Cir Lagrange, GA 30241
Estimated Value: $217,000 - $227,185
3
Beds
2
Baths
1,370
Sq Ft
$162/Sq Ft
Est. Value
About This Home
This home is located at 117 Woodridge Cir, Lagrange, GA 30241 and is currently estimated at $222,546, approximately $162 per square foot. 117 Woodridge Cir is a home located in Troup County with nearby schools including Callaway Elementary School, Hogansville Elementary School, and Callaway Middle School.
Ownership History
Date
Name
Owned For
Owner Type
Purchase Details
Closed on
Apr 6, 2022
Sold by
Todd Judy B
Bought by
Gillespie Macheri
Current Estimated Value
Home Financials for this Owner
Home Financials are based on the most recent Mortgage that was taken out on this home.
Original Mortgage
$157,102
Outstanding Balance
$146,998
Interest Rate
3.89%
Mortgage Type
FHA
Estimated Equity
$75,548
Purchase Details
Closed on
Aug 10, 2000
Sold by
Fomby William T
Bought by
Todd Judy B
Purchase Details
Closed on
Aug 13, 1999
Sold by
Spinks Brown and Spinks Durand
Bought by
Fomby William T
Purchase Details
Closed on
Aug 12, 1999
Sold by
Commercial Bank & Trust
Bought by
Spinks Brown and Spinks Durand
Purchase Details
Closed on
Aug 12, 1994
Bought by
Commercial Bank & Trust
Create a Home Valuation Report for This Property
The Home Valuation Report is an in-depth analysis detailing your home's value as well as a comparison with similar homes in the area
Home Values in the Area
Average Home Value in this Area
Purchase History
| Date | Buyer | Sale Price | Title Company |
|---|---|---|---|
| Gillespie Macheri | $160,000 | -- | |
| Todd Judy B | $94,900 | -- | |
| Fomby William T | $35,300 | -- | |
| Spinks Brown | -- | -- | |
| Commercial Bank & Trust | -- | -- |
Source: Public Records
Mortgage History
| Date | Status | Borrower | Loan Amount |
|---|---|---|---|
| Open | Gillespie Macheri | $157,102 |
Source: Public Records
Tax History Compared to Growth
Tax History
| Year | Tax Paid | Tax Assessment Tax Assessment Total Assessment is a certain percentage of the fair market value that is determined by local assessors to be the total taxable value of land and additions on the property. | Land | Improvement |
|---|---|---|---|---|
| 2024 | $1,803 | $66,120 | $14,000 | $52,120 |
| 2023 | $1,792 | $65,720 | $14,000 | $51,720 |
| 2022 | $1,499 | $53,720 | $10,000 | $43,720 |
| 2021 | $1,208 | $47,800 | $8,000 | $39,800 |
| 2020 | $1,208 | $47,800 | $8,000 | $39,800 |
| 2019 | $1,035 | $42,080 | $8,000 | $34,080 |
| 2018 | $850 | $35,920 | $6,000 | $29,920 |
| 2017 | $850 | $35,920 | $6,000 | $29,920 |
| 2016 | $834 | $35,386 | $6,000 | $29,386 |
| 2015 | $834 | $35,386 | $6,000 | $29,386 |
| 2014 | $787 | $33,839 | $6,000 | $27,839 |
| 2013 | -- | $34,456 | $6,000 | $28,456 |
Source: Public Records
Map
Nearby Homes
- 121 Woodridge Cir
- 113 Woodridge Cir
- 125 Ridgefield Cir
- 456 Brookstone Dr
- 105 Ridgefield Dr
- 207 Baileys Way
- 224 Old Pond Rd
- 244 Old Pond Rd
- 300 Old Pond Rd
- 250 Old Pond Rd
- 509 Youngs Mill Rd
- 793 Celebration Blvd
- 227 River Meadow Dr Unit H14
- 231 River Meadow Dr
- 412 Sweetwood Ct Unit A36
- 112 Celebration Blvd
- 117 Celebration Blvd
- 105 Lenox Cir
- 101 Lenox Cir
- 305 Lenox Cir
- 115 Woodridge Cir
- 119 Woodridge Cir
- 310 Brookfield Dr
- 110 Woodridge Cir
- 112 Woodridge Cir
- 121 Woodridge Cir Unit 35
- 313 Brookfield Dr
- 308 Brookfield Dr
- 111 Woodridge Cir
- 108 Woodridge Cir
- 311 Brookfield Dr Unit 44
- 311 Brookfield Dr
- 114 Woodridge Cir
- 123 Woodridge Cir
- 109 Woodridge Cir
- 109 Woodridge Ct
- 309 Brookfield Dr
- 106 Woodridge Cir
- 433 Brookstone Dr
- 0 Brookfield Dr