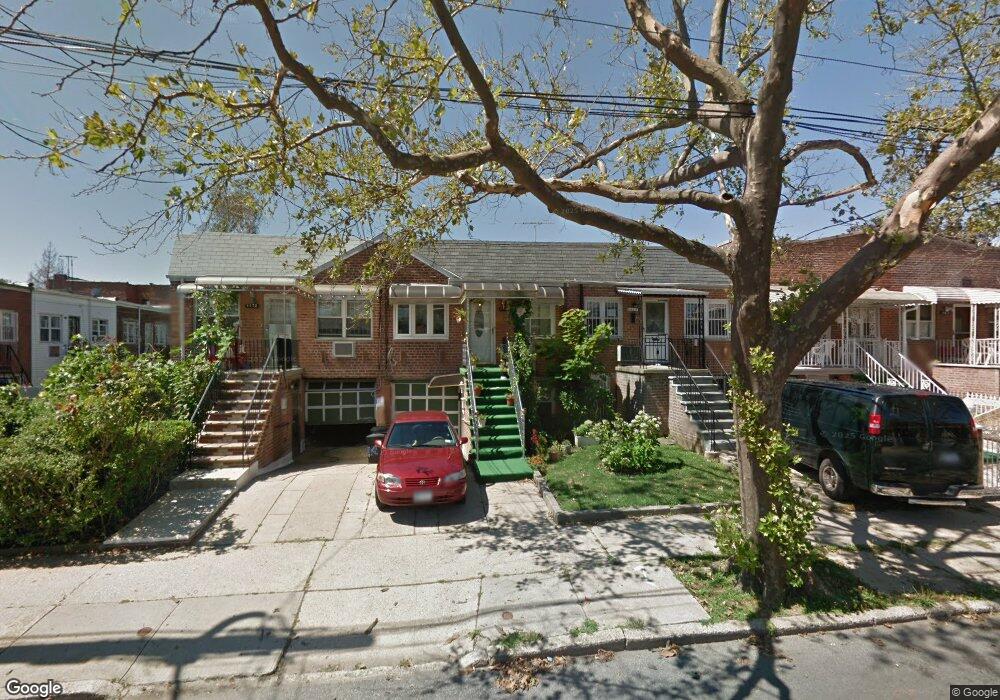
1170 E 100th St Brooklyn, NY 11236
Canarsie NeighborhoodEstimated Value: $709,319 - $810,000
4
Beds
2
Baths
1,540
Sq Ft
$496/Sq Ft
Est. Value
About This Home
This home is located at 1170 E 100th St, Brooklyn, NY 11236 and is currently estimated at $763,830, approximately $495 per square foot. 1170 E 100th St is a home located in Kings County with nearby schools including P.S. 279 Herman Schreiber, I.S. 211 John Wilson, and Canarsie Ascend Charter School.
Ownership History
Date
Name
Owned For
Owner Type
Purchase Details
Closed on
Feb 4, 2010
Sold by
Rampartap Bernice and Smith Richard
Bought by
Sharpe Joel and Sharpe Linetia
Current Estimated Value
Home Financials for this Owner
Home Financials are based on the most recent Mortgage that was taken out on this home.
Original Mortgage
$368,207
Outstanding Balance
$239,796
Interest Rate
4.87%
Mortgage Type
FHA
Estimated Equity
$524,034
Purchase Details
Closed on
Mar 23, 2001
Sold by
Greenspan Elliot and Hafter Dorothy S
Bought by
Smith Richard and Rampartap Bernice G
Home Financials for this Owner
Home Financials are based on the most recent Mortgage that was taken out on this home.
Original Mortgage
$198,940
Interest Rate
7.05%
Mortgage Type
Purchase Money Mortgage
Purchase Details
Closed on
May 2, 1998
Sold by
Greenspan Elliot
Bought by
Greenspan Elliot and Hafter Dorothy S
Purchase Details
Closed on
Jan 17, 1998
Sold by
Greenspan Norma
Bought by
Greenspan Elliot and Hafter Dorothy S
Create a Home Valuation Report for This Property
The Home Valuation Report is an in-depth analysis detailing your home's value as well as a comparison with similar homes in the area
Home Values in the Area
Average Home Value in this Area
Purchase History
| Date | Buyer | Sale Price | Title Company |
|---|---|---|---|
| Sharpe Joel | $385,000 | -- | |
| Sharpe Joel | $385,000 | -- | |
| Smith Richard | -- | -- | |
| Smith Richard | -- | -- | |
| Greenspan Elliot | -- | Stewart Title Insurance Co | |
| Greenspan Elliot | -- | Stewart Title Insurance Co | |
| Greenspan Elliot | -- | Commonwealth Land Title Ins | |
| Greenspan Elliot | -- | Commonwealth Land Title Ins |
Source: Public Records
Mortgage History
| Date | Status | Borrower | Loan Amount |
|---|---|---|---|
| Open | Sharpe Joel | $368,207 | |
| Closed | Sharpe Joel | $368,207 | |
| Previous Owner | Smith Richard | $198,940 |
Source: Public Records
Tax History
| Year | Tax Paid | Tax Assessment Tax Assessment Total Assessment is a certain percentage of the fair market value that is determined by local assessors to be the total taxable value of land and additions on the property. | Land | Improvement |
|---|---|---|---|---|
| 2025 | $5,428 | $40,860 | $7,860 | $33,000 |
| 2024 | $5,428 | $41,100 | $7,860 | $33,240 |
| 2023 | $5,445 | $37,680 | $7,860 | $29,820 |
| 2022 | $5,026 | $30,840 | $7,860 | $22,980 |
| 2021 | $4,988 | $32,160 | $7,860 | $24,300 |
| 2020 | $2,330 | $30,420 | $7,860 | $22,560 |
| 2019 | $4,662 | $30,720 | $7,860 | $22,860 |
| 2018 | $4,495 | $23,509 | $5,559 | $17,950 |
| 2017 | $4,222 | $22,179 | $6,330 | $15,849 |
| 2016 | $3,873 | $20,924 | $6,173 | $14,751 |
| 2015 | $2,731 | $19,740 | $8,760 | $10,980 |
| 2014 | $2,731 | $19,740 | $8,760 | $10,980 |
Source: Public Records
Map
Nearby Homes
- 1154 E 100th St
- 10009 Avenue L
- 1154 E 101st St
- 10016 Avenue L
- 1124 E 100th St
- 1161 E 101st St
- 1130 E 99th St
- 10106 Avenue L
- 1118 E 101st St
- 1131 E 101st St
- 1725 Rockaway Pkwy
- 1707 Rockaway Pkwy
- 9722 Avenue K
- 1791 Rockaway Pkwy
- 1115 E 102nd St
- 1054 E 100th St
- 10224 Avenue K
- 1450 E 98th St
- 1258 E 98th St
- 1241 E 98th St
- 1172 E 100th St
- 1168 E 100th St
- 1164 E 100th St
- 1162 E 100th St
- 9919 Avenue L Unit 1
- 9919 Avenue L Unit 2
- 9919 Avenue L
- 9917 Avenue L
- 1160 E 100th St
- 9915 Avenue L
- 9921 Avenue L
- 9911 Avenue L
- 1158 E 100th St
- 1159 E 99th St
- 1161 E 99th St
- 1157 E 99th St
- 1163 E 99th St
- 1163 E 99th St Unit 2
- 9909 Avenue L
- 1155 E 99th St