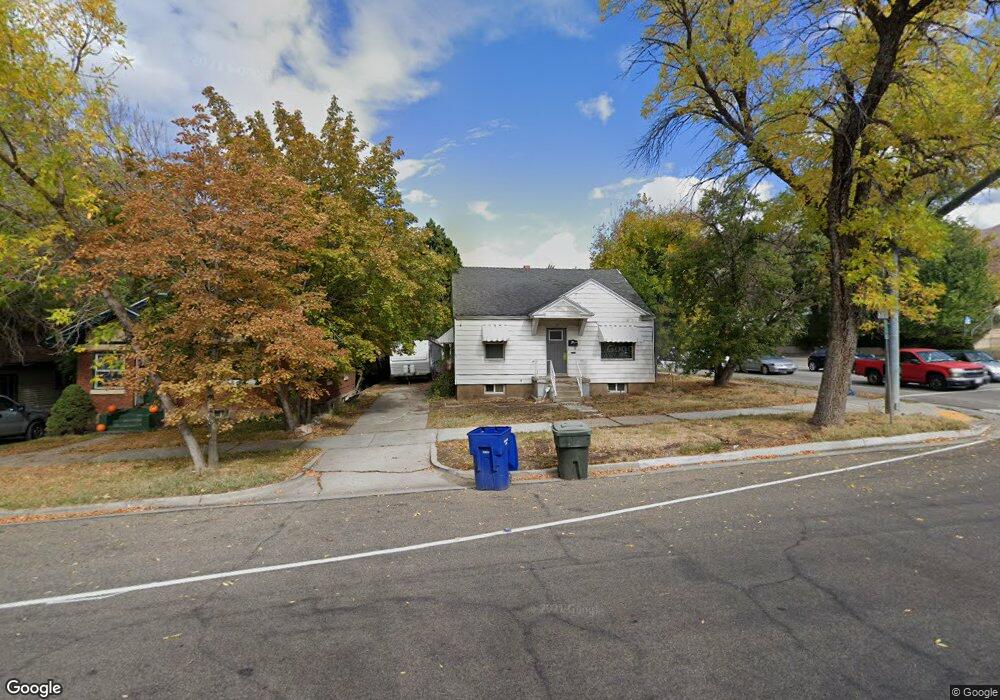
1170 E 22nd St Ogden, UT 84401
East Central Ogden NeighborhoodEstimated Value: $354,000 - $384,178
4
Beds
2
Baths
2,160
Sq Ft
$172/Sq Ft
Est. Value
About This Home
This home is located at 1170 E 22nd St, Ogden, UT 84401 and is currently estimated at $370,545, approximately $171 per square foot. 1170 E 22nd St is a home located in Weber County with nearby schools including New Bridge School, Mound Fort Junior High School, and Ogden High School.
Ownership History
Date
Name
Owned For
Owner Type
Purchase Details
Closed on
Jun 8, 2009
Sold by
Scott Karl W and Scott Genissa
Bought by
Scott Genissa and Scott Karl W
Current Estimated Value
Purchase Details
Closed on
Aug 19, 2002
Sold by
Fairbanks Capital Corp
Bought by
Scott Karl W and Scott Genissa
Home Financials for this Owner
Home Financials are based on the most recent Mortgage that was taken out on this home.
Original Mortgage
$70,500
Outstanding Balance
$29,768
Interest Rate
6.52%
Estimated Equity
$340,777
Purchase Details
Closed on
Jun 19, 2002
Sold by
Shaw Donald L
Bought by
Fairbanks Capital Corp
Purchase Details
Closed on
May 1, 1998
Sold by
Shaw Donald L and Shaw Jana L
Bought by
Shaw Donald L
Home Financials for this Owner
Home Financials are based on the most recent Mortgage that was taken out on this home.
Original Mortgage
$61,200
Interest Rate
11.25%
Create a Home Valuation Report for This Property
The Home Valuation Report is an in-depth analysis detailing your home's value as well as a comparison with similar homes in the area
Home Values in the Area
Average Home Value in this Area
Purchase History
| Date | Buyer | Sale Price | Title Company |
|---|---|---|---|
| Scott Genissa | -- | Mountain View Title Ogd | |
| Scott Karl W | -- | First American Title | |
| Fairbanks Capital Corp | $71,815 | Backman Stewart Title | |
| Shaw Donald L | -- | Bonneville Title |
Source: Public Records
Mortgage History
| Date | Status | Borrower | Loan Amount |
|---|---|---|---|
| Open | Scott Karl W | $70,500 | |
| Previous Owner | Shaw Donald L | $61,200 | |
| Closed | Scott Genissa | $0 |
Source: Public Records
Tax History
| Year | Tax Paid | Tax Assessment Tax Assessment Total Assessment is a certain percentage of the fair market value that is determined by local assessors to be the total taxable value of land and additions on the property. | Land | Improvement |
|---|---|---|---|---|
| 2025 | $2,769 | $352,360 | $113,583 | $238,777 |
| 2024 | $2,753 | $191,397 | $62,470 | $128,927 |
| 2023 | $2,552 | $178,751 | $53,461 | $125,290 |
| 2022 | $2,766 | $198,550 | $47,982 | $150,568 |
| 2021 | $2,342 | $274,000 | $47,022 | $226,978 |
| 2020 | $1,999 | $212,000 | $36,649 | $175,351 |
| 2019 | $1,938 | $192,000 | $31,570 | $160,430 |
| 2018 | $1,732 | $168,000 | $26,488 | $141,512 |
| 2017 | $1,488 | $131,000 | $26,488 | $104,512 |
| 2016 | $1,294 | $59,995 | $13,214 | $46,781 |
| 2015 | $1,167 | $51,709 | $13,214 | $38,495 |
| 2014 | $1,112 | $48,530 | $11,558 | $36,972 |
Source: Public Records
Map
Nearby Homes
Your Personal Tour Guide
Ask me questions while you tour the home.