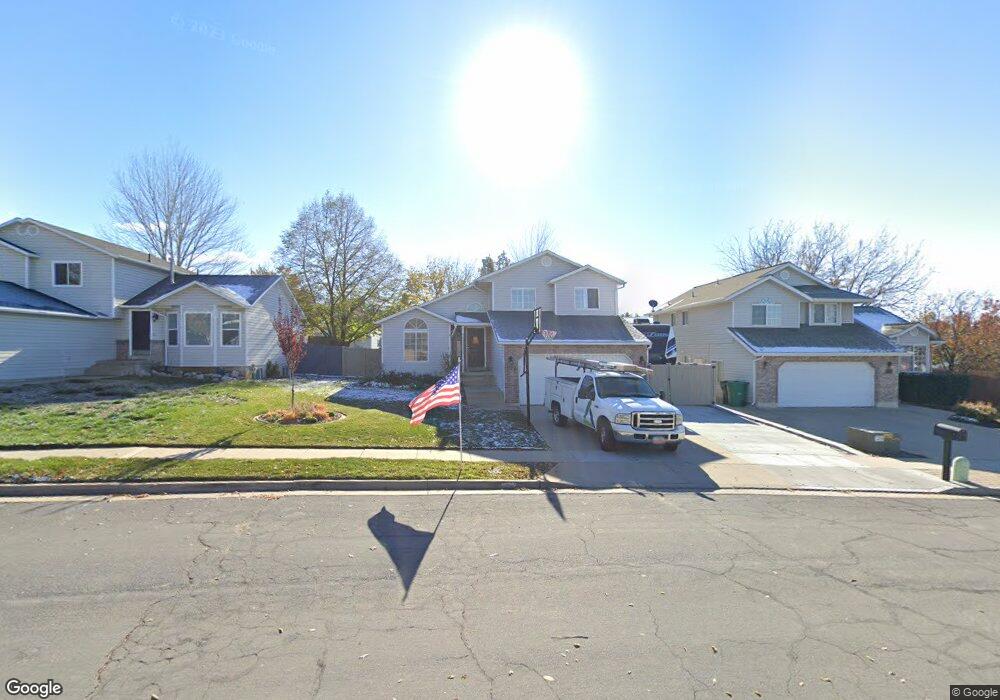
1170 E 750 S Layton, UT 84041
Estimated Value: $477,000 - $522,000
3
Beds
3
Baths
1,850
Sq Ft
$269/Sq Ft
Est. Value
About This Home
This home is located at 1170 E 750 S, Layton, UT 84041 and is currently estimated at $497,083, approximately $268 per square foot. 1170 E 750 S is a home located in Davis County with nearby schools including Creekside Elementary School, Fairfield Junior High School, and Davis High School.
Ownership History
Date
Name
Owned For
Owner Type
Purchase Details
Closed on
Jun 22, 2018
Sold by
Winget James
Bought by
Winget James and Winget Karen E
Current Estimated Value
Home Financials for this Owner
Home Financials are based on the most recent Mortgage that was taken out on this home.
Original Mortgage
$298,493
Outstanding Balance
$262,339
Interest Rate
5.25%
Mortgage Type
FHA
Estimated Equity
$234,744
Purchase Details
Closed on
Oct 7, 2016
Sold by
Morrell Nick
Bought by
Morrwll Nick and Morrwll Ann
Purchase Details
Closed on
Nov 3, 2006
Sold by
Ray Brian D and Ray Jenny
Bought by
Checketts Samuel and Checketts Amy
Home Financials for this Owner
Home Financials are based on the most recent Mortgage that was taken out on this home.
Original Mortgage
$42,400
Interest Rate
5.96%
Mortgage Type
Stand Alone Second
Purchase Details
Closed on
Mar 25, 2003
Sold by
Ray Brian D and Chiles Jenny
Bought by
Ray Brian D and Ray Jenny
Home Financials for this Owner
Home Financials are based on the most recent Mortgage that was taken out on this home.
Original Mortgage
$143,360
Interest Rate
5.79%
Mortgage Type
FHA
Purchase Details
Closed on
Nov 29, 2001
Sold by
Jeppsen Troy G and Jeppsen Catherine M
Bought by
Ray Brian D and Chiles Jenny
Home Financials for this Owner
Home Financials are based on the most recent Mortgage that was taken out on this home.
Original Mortgage
$142,759
Interest Rate
6.63%
Mortgage Type
FHA
Purchase Details
Closed on
Oct 14, 1999
Sold by
Jeppsen Troy G
Bought by
Jeppsen Troy G and Jeppsen Cathrine M
Purchase Details
Closed on
Mar 19, 1999
Sold by
Squires David G
Bought by
Jeppsen Troy G
Home Financials for this Owner
Home Financials are based on the most recent Mortgage that was taken out on this home.
Original Mortgage
$124,450
Interest Rate
6.73%
Mortgage Type
Purchase Money Mortgage
Purchase Details
Closed on
Feb 26, 1998
Sold by
Williams W Randy and Williams Tami A
Bought by
Squires David G
Home Financials for this Owner
Home Financials are based on the most recent Mortgage that was taken out on this home.
Original Mortgage
$126,329
Interest Rate
6.9%
Mortgage Type
FHA
Purchase Details
Closed on
Feb 14, 1997
Sold by
Williams Rand and Williams Tami
Bought by
Williams W Randy and Williams Tami A
Home Financials for this Owner
Home Financials are based on the most recent Mortgage that was taken out on this home.
Original Mortgage
$105,500
Interest Rate
7.85%
Mortgage Type
Purchase Money Mortgage
Create a Home Valuation Report for This Property
The Home Valuation Report is an in-depth analysis detailing your home's value as well as a comparison with similar homes in the area
Home Values in the Area
Average Home Value in this Area
Purchase History
| Date | Buyer | Sale Price | Title Company |
|---|---|---|---|
| Winget James | -- | Security Title | |
| Winget James | -- | Guarantee Title | |
| Morrwll Nick | -- | Guarantee Title | |
| Morrwll Nick | -- | Guarantee Title | |
| Checketts Samuel | -- | Security Title | |
| Ray Brian D | -- | Equity Title Agency | |
| Ray Brian D | -- | Mountain View Title & Escrow | |
| Jeppsen Troy G | -- | -- | |
| Jeppsen Troy G | -- | Security Title Insurance | |
| Squires David G | -- | Equity Title Agency | |
| Williams W Randy | -- | Backman Stewart Title Servic |
Source: Public Records
Mortgage History
| Date | Status | Borrower | Loan Amount |
|---|---|---|---|
| Open | Winget James | $298,493 | |
| Previous Owner | Checketts Samuel | $42,400 | |
| Previous Owner | Ray Brian D | $143,360 | |
| Previous Owner | Ray Brian D | $142,759 | |
| Previous Owner | Jeppsen Troy G | $124,450 | |
| Previous Owner | Squires David G | $126,329 | |
| Previous Owner | Williams W Randy | $105,500 |
Source: Public Records
Tax History
| Year | Tax Paid | Tax Assessment Tax Assessment Total Assessment is a certain percentage of the fair market value that is determined by local assessors to be the total taxable value of land and additions on the property. | Land | Improvement |
|---|---|---|---|---|
| 2025 | $2,216 | $232,650 | $89,910 | $142,740 |
| 2024 | $2,117 | $223,850 | $105,447 | $118,403 |
| 2023 | $2,092 | $390,000 | $131,892 | $258,108 |
| 2022 | $2,190 | $221,650 | $67,764 | $153,886 |
| 2021 | $2,040 | $308,000 | $90,054 | $217,946 |
| 2020 | $1,844 | $267,000 | $77,849 | $189,151 |
| 2019 | $1,798 | $255,000 | $75,880 | $179,120 |
| 2018 | $1,580 | $225,000 | $75,880 | $149,120 |
| 2016 | $1,456 | $106,975 | $22,884 | $84,091 |
| 2015 | $1,399 | $97,570 | $22,884 | $74,686 |
| 2014 | $1,502 | $107,062 | $22,884 | $84,178 |
| 2013 | -- | $93,688 | $19,034 | $74,654 |
Source: Public Records
Map
Nearby Homes
- 772 N Crimson Ln
- 766 N Stonne Ln
- 1368 E 275 S
- 679 S Clearwater Falls Dr
- 680 N Main St Trlr E-11
- 524 Hyde Park Ln
- 1137 Holmes Creek Ln
- 895 S Main St Unit E
- 680 N Main St Unit B13
- 680 N Main St Unit D14
- 1328 E Orchard Ridge Ln
- 917 S Main St Unit H
- 905 S Main St Unit G
- 623 E Clearwater Dr Unit 15
- 706 S 600 E
- 811 S Main St
- 150 E 600 N Unit 5
- 150 E 600 N Unit 18
- 420 N Main St Unit 22
- 617 E 405 S
- 1170 E Meadow Way Dr
- 1170 Meadow Way Dr
- 1180 E Meadow Way Dr
- 1180 Meadow Way Dr
- 1160 E Meadow Way Dr
- 1160 Meadow Way Dr
- 1188 Meadow Way Dr
- 268 W Mutton Hollow Rd
- 260 W Mutton Hollow Rd
- 733 Fox Run
- 278 W Mutton Hollow Rd
- 252 W Mutton Hollow Rd
- 1179 Meadow Way Dr
- 1196 Meadow Way Dr
- 723 Fox Run
- 1140 E 750 S
- 1140 Meadow Way Dr
- 244 W Mutton Hollow Rd
- 1187 Meadow Way Dr
- 1204 E 750 S
Your Personal Tour Guide
Ask me questions while you tour the home.