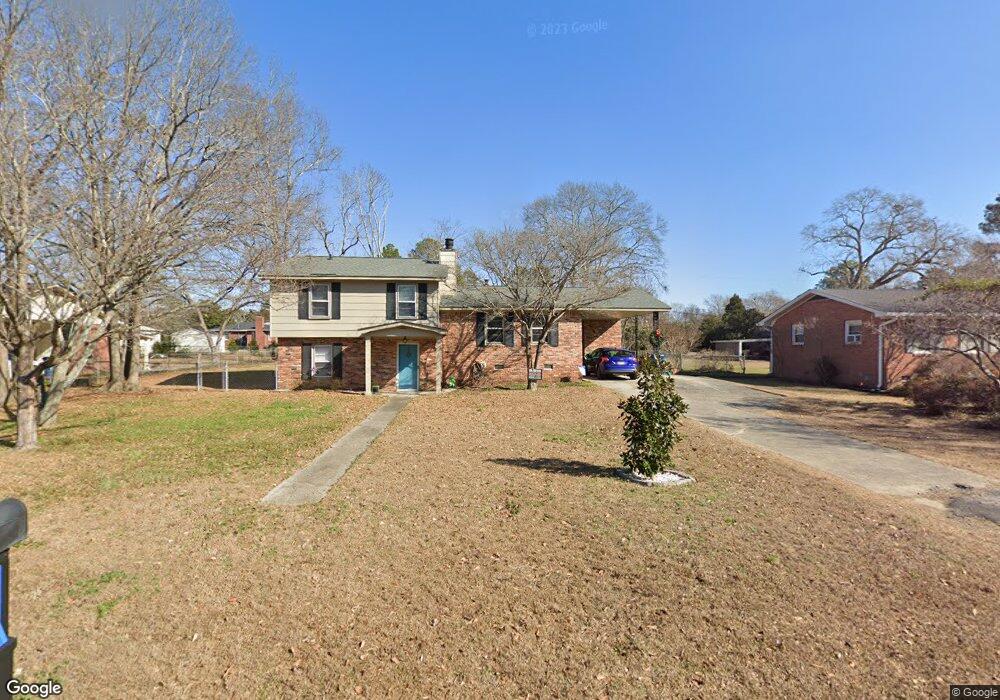
1170 Gunter Cir West Columbia, SC 29169
Estimated Value: $253,000 - $292,000
5
Beds
2
Baths
2,025
Sq Ft
$132/Sq Ft
Est. Value
About This Home
This home is located at 1170 Gunter Cir, West Columbia, SC 29169 and is currently estimated at $267,326, approximately $132 per square foot. 1170 Gunter Cir is a home located in Lexington County with nearby schools including Saluda River Academy For The Arts, Northside Middle, and Brookland-Cayce High School.
Ownership History
Date
Name
Owned For
Owner Type
Purchase Details
Closed on
Jun 11, 2021
Sold by
Thompson Kimberly B
Bought by
Thompson Kimberly B and Thompson Angela R
Current Estimated Value
Home Financials for this Owner
Home Financials are based on the most recent Mortgage that was taken out on this home.
Original Mortgage
$133,300
Outstanding Balance
$120,687
Interest Rate
2.9%
Mortgage Type
New Conventional
Estimated Equity
$146,639
Purchase Details
Closed on
Mar 20, 2017
Sold by
Collins Kevin Luke and Ramsey Drawn Tamber
Bought by
Thompson Kimberly B
Home Financials for this Owner
Home Financials are based on the most recent Mortgage that was taken out on this home.
Original Mortgage
$123,500
Interest Rate
4.15%
Mortgage Type
New Conventional
Purchase Details
Closed on
May 17, 1999
Sold by
Sexton Nancy M
Bought by
Collins Kevin Luke
Create a Home Valuation Report for This Property
The Home Valuation Report is an in-depth analysis detailing your home's value as well as a comparison with similar homes in the area
Home Values in the Area
Average Home Value in this Area
Purchase History
| Date | Buyer | Sale Price | Title Company |
|---|---|---|---|
| Thompson Kimberly B | -- | Avenue 365 Lender Svcs Llc | |
| Thompson Kimberly B | $133,500 | None Available | |
| Collins Kevin Luke | $97,500 | -- |
Source: Public Records
Mortgage History
| Date | Status | Borrower | Loan Amount |
|---|---|---|---|
| Open | Thompson Kimberly B | $133,300 | |
| Closed | Thompson Kimberly B | $123,500 |
Source: Public Records
Tax History Compared to Growth
Tax History
| Year | Tax Paid | Tax Assessment Tax Assessment Total Assessment is a certain percentage of the fair market value that is determined by local assessors to be the total taxable value of land and additions on the property. | Land | Improvement |
|---|---|---|---|---|
| 2024 | $1,172 | $5,526 | $1,400 | $4,126 |
| 2023 | $1,057 | $5,526 | $1,400 | $4,126 |
| 2022 | $1,067 | $5,526 | $1,400 | $4,126 |
| 2020 | $1,025 | $5,526 | $1,400 | $4,126 |
| 2019 | $1,009 | $5,340 | $1,400 | $3,940 |
| 2018 | $1,020 | $5,340 | $1,400 | $3,940 |
| 2017 | $900 | $4,909 | $1,400 | $3,509 |
| 2016 | $2,595 | $7,363 | $2,100 | $5,263 |
| 2014 | $2,408 | $7,860 | $1,641 | $6,219 |
| 2013 | -- | $7,860 | $1,640 | $6,220 |
Source: Public Records
Map
Nearby Homes
- 318 Skipperling Ln
- 100 Double Branch Ct
- 929-931 Central Dr
- 1100 Seminole Dr
- 1715 Gilvie Ave
- 1344 Gilmore St
- 941 Mohegan Trail
- 816 Fontanna Ave
- 916 Mohegan Trail
- 638 Carrington Dr
- 1500 Redwood Dr
- 633 Edgewater Ln
- 634 Edgewater Ln
- 1540 Sewanee Dr
- 617 Holland Cir
- 918 N Lucas St
- 225 Edgewater Ln
- 121 Edgewater Ln
- 165 Cavendish Dr
- 106 Earl Ct
- 1166 Gunter Cir
- 1174 Gunter Cir
- 1129 Gunter Cir
- 1133 Gunter Cir
- 1125 Gunter Cir
- 1178 Gunter Cir
- 1162 Gunter Cir
- 1167 Gunter Cir
- 1171 Gunter Cir
- 1163 Gunter Cir
- 1137 Gunter Cir
- 1121 Gunter Cir
- 1175 Gunter Cir
- 1158 Gunter Cir
- 1182 Gunter Cir
- 1159 Gunter Cir
- 1141 Gunter Cir
- 1117 Gunter Cir
- 1179 Gunter Cir
- 1100 Rutland Ave