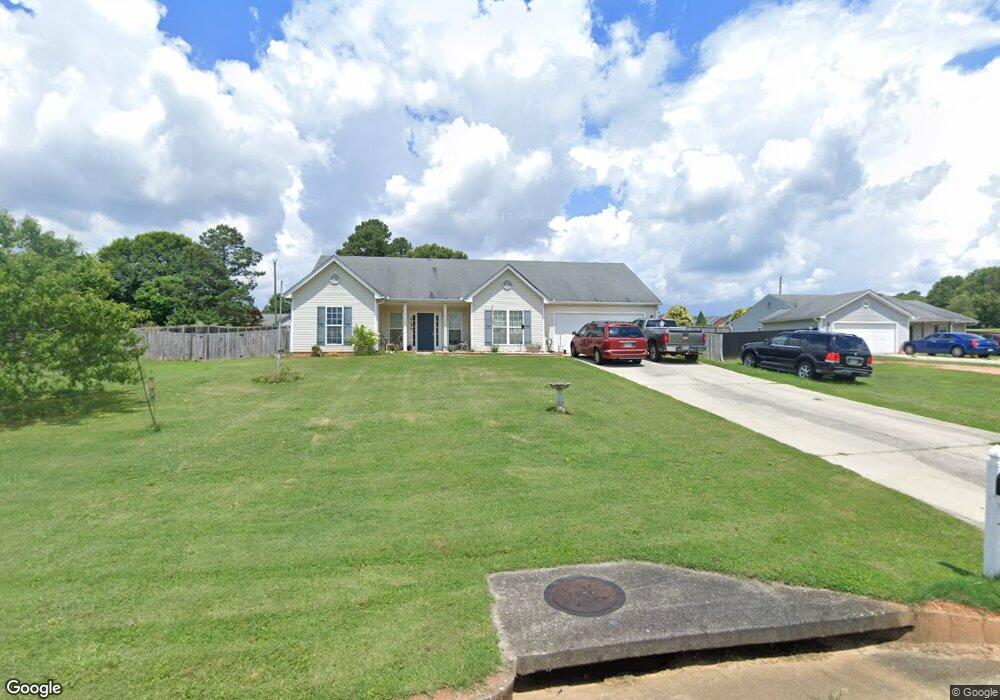
1170 Langdon Park Cir Winder, GA 30680
Estimated Value: $319,000 - $344,000
3
Beds
2
Baths
1,646
Sq Ft
$202/Sq Ft
Est. Value
About This Home
This home is located at 1170 Langdon Park Cir, Winder, GA 30680 and is currently estimated at $333,283, approximately $202 per square foot. 1170 Langdon Park Cir is a home located in Barrow County with nearby schools including Bethlehem Elementary School, Haymon-Morris Middle School, and Apalachee High School.
Ownership History
Date
Name
Owned For
Owner Type
Purchase Details
Closed on
Jul 8, 2011
Sold by
Renfro Charles E V and Renfro Rachel L
Bought by
Watson Judy and Watson William
Current Estimated Value
Home Financials for this Owner
Home Financials are based on the most recent Mortgage that was taken out on this home.
Original Mortgage
$82,600
Outstanding Balance
$56,853
Interest Rate
4.52%
Mortgage Type
VA
Estimated Equity
$276,430
Purchase Details
Closed on
Jul 27, 2007
Sold by
Southfork Hms Inc
Bought by
Renfro Charles E and Renfro Rachel L
Home Financials for this Owner
Home Financials are based on the most recent Mortgage that was taken out on this home.
Original Mortgage
$146,402
Interest Rate
6.65%
Mortgage Type
FHA
Purchase Details
Closed on
Jul 17, 2006
Sold by
Colonial Development Inc
Bought by
Southfork Homes Inc
Purchase Details
Closed on
Jul 22, 2004
Bought by
Colonial Development Inc
Create a Home Valuation Report for This Property
The Home Valuation Report is an in-depth analysis detailing your home's value as well as a comparison with similar homes in the area
Home Values in the Area
Average Home Value in this Area
Purchase History
| Date | Buyer | Sale Price | Title Company |
|---|---|---|---|
| Watson Judy | $80,000 | -- | |
| Renfro Charles E | $148,700 | -- | |
| Southfork Homes Inc | $40,000 | -- | |
| Colonial Development Inc | -- | -- |
Source: Public Records
Mortgage History
| Date | Status | Borrower | Loan Amount |
|---|---|---|---|
| Open | Watson Judy | $82,600 | |
| Previous Owner | Renfro Charles E | $146,402 |
Source: Public Records
Tax History Compared to Growth
Tax History
| Year | Tax Paid | Tax Assessment Tax Assessment Total Assessment is a certain percentage of the fair market value that is determined by local assessors to be the total taxable value of land and additions on the property. | Land | Improvement |
|---|---|---|---|---|
| 2024 | $1,515 | $112,621 | $24,800 | $87,821 |
| 2023 | $1,036 | $109,362 | $24,800 | $84,562 |
| 2022 | $652 | $64,222 | $16,000 | $48,222 |
| 2021 | $695 | $64,222 | $16,000 | $48,222 |
| 2020 | $684 | $64,222 | $16,000 | $48,222 |
| 2019 | $662 | $60,063 | $16,000 | $44,063 |
| 2018 | $630 | $59,822 | $11,600 | $48,222 |
| 2017 | $1,275 | $43,795 | $11,600 | $32,195 |
| 2016 | $430 | $44,141 | $11,600 | $32,541 |
| 2015 | $436 | $44,486 | $11,600 | $32,886 |
| 2014 | $762 | $41,072 | $7,840 | $33,232 |
| 2013 | -- | $39,095 | $7,840 | $31,255 |
Source: Public Records
Map
Nearby Homes
- 112 Shallow Way
- 0 Perkins Rd Unit 10623675
- 0 Perkins Rd Unit 7664605
- 1190 Foster Rd
- 84 Morningdale Cir
- 2439 Kumbanad Ct
- 1 Us 53 Hwy
- 890 Smith Mill Rd
- 0 Wall Rd Unit 10504981
- 0 Wall Rd Unit 7564754
- 572 Elder Rd SE
- 568 Elder Rd SE
- 564 Elder Rd SE
- 576 Elder Rd SE
- The Everglade Plan at Sutton's Landing - Sutton’s Landing
- The Farmington Plan at Sutton's Landing - Sutton’s Landing
- 938 Austin Rd
- 223 Westlyn Way
- 1006 Trichur Rd
- 1211 Hog Mountain Rd
- 1180 Langdon Park Cir
- 0 Langdon Park Cir Unit 7541699
- 1160 Langdon Park Cir
- 1429 Langdon Park Cir
- 1080 Bethlehem Rd
- 1080 Bethlehem Rd
- 1190 Langdon Park Cir
- 1175 Langdon Park Cir
- 1155 Langdon Park Cir
- 1086 Bethlehem Rd
- 1185 Langdon Park Cir
- 1562 Langdon Park Dr
- 1564 Langdon Park Dr
- 1074 Bethlehem Rd
- 1602 Queens Dr
- Lot 36 Langdon Park Dr #36
- 1568 Langdon Park Dr
- 1451 Perkins Rd
- 0 Bethlehem Rd Unit 8209206
- 0 Bethlehem Rd Unit 8416455