Estimated Value: $133,000 - $140,789
4
Beds
1
Bath
2,454
Sq Ft
$56/Sq Ft
Est. Value
About This Home
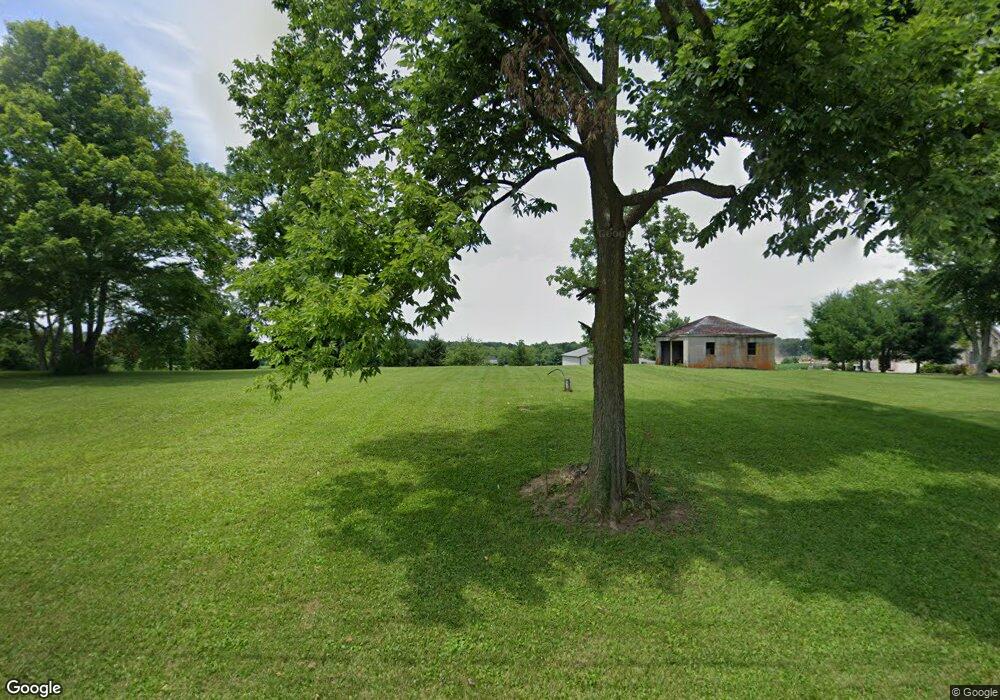
This home is located at 1170 Lower Bellbrook Rd, Xenia, OH 45385 and is currently estimated at $136,895, approximately $55 per square foot. 1170 Lower Bellbrook Rd is a home located in Greene County with nearby schools including Xenia High School and Summit Academy Community School for Alternative Learners - Xenia.
Ownership History
Date
Name
Owned For
Owner Type
Purchase Details
Closed on
Jan 24, 2011
Sold by
Barnett Donald L and Barnett Mildred J
Bought by
Barnett Donald L and The Donald L Barnett Living Trust
Current Estimated Value
Purchase Details
Closed on
Jan 21, 2005
Sold by
Kyne Larry T
Bought by
Barnett Donald L and Barnett Mildred J
Purchase Details
Closed on
Dec 8, 2004
Sold by
Kyne Larry T
Bought by
Kyne Larry T
Purchase Details
Closed on
Oct 29, 2002
Sold by
Kyne Larry T
Bought by
Ali Masoud and Gumbert Mary
Home Financials for this Owner
Home Financials are based on the most recent Mortgage that was taken out on this home.
Original Mortgage
$248,900
Interest Rate
4.12%
Mortgage Type
Construction
Purchase Details
Closed on
Oct 14, 1999
Sold by
Kyne Edna V
Bought by
Kyne Larry T
Purchase Details
Closed on
Mar 19, 1999
Sold by
Kyne Larry T
Bought by
Bryant Carl and Bryant Anita K
Create a Home Valuation Report for This Property
The Home Valuation Report is an in-depth analysis detailing your home's value as well as a comparison with similar homes in the area
Home Values in the Area
Average Home Value in this Area
Purchase History
| Date | Buyer | Sale Price | Title Company |
|---|---|---|---|
| Barnett Donald L | -- | Attorney | |
| Barnett Donald L | $69,000 | -- | |
| Kyne Larry T | -- | -- | |
| Ali Masoud | $73,400 | -- | |
| Ali Masoud | $73,400 | -- | |
| Michael Leonard L | $75,100 | -- | |
| Kyne Larry T | -- | -- | |
| Bryant Carl | $74,500 | -- |
Source: Public Records
Mortgage History
| Date | Status | Borrower | Loan Amount |
|---|---|---|---|
| Previous Owner | Michael Leonard L | $248,900 |
Source: Public Records
Tax History Compared to Growth
Tax History
| Year | Tax Paid | Tax Assessment Tax Assessment Total Assessment is a certain percentage of the fair market value that is determined by local assessors to be the total taxable value of land and additions on the property. | Land | Improvement |
|---|---|---|---|---|
| 2024 | $288 | $30,420 | $30,190 | $230 |
| 2023 | $288 | $30,420 | $30,190 | $230 |
| 2022 | $168 | $26,620 | $26,400 | $220 |
| 2021 | $170 | $26,620 | $26,400 | $220 |
| 2020 | $156 | $26,620 | $26,400 | $220 |
| 2019 | $466 | $26,570 | $23,140 | $3,430 |
| 2018 | $460 | $26,570 | $23,140 | $3,430 |
| 2017 | $545 | $26,570 | $23,140 | $3,430 |
| 2016 | $545 | $24,660 | $21,400 | $3,260 |
| 2015 | $1,588 | $56,800 | $18,870 | $37,930 |
| 2014 | $3,050 | $56,800 | $18,870 | $37,930 |
Source: Public Records
Map
Nearby Homes
- Chatham Plan at Edenbridge
- Bellamy Plan at Edenbridge
- Holcombe Plan at Edenbridge
- Henley Plan at Edenbridge
- Newcastle Plan at Edenbridge
- 1474 Hawkshead St
- 1292 Baybury Ave
- 1272 Baybury Ave
- 1256 Baybury Ave
- 1293 Baybury Ave
- 1304 Baybury Ave
- 1298 Baybury Ave
- 1282 Baybury Ave
- 1358 Shannon Ln
- 2821 Raxit Ct
- 1318 Prem Place
- 1248 Prem Place
- 2784 Greystoke Dr
- 1161 Shannon Ln
- 0 Berkshire Dr Unit 949217
- 1164 Lower Bellbrook Rd
- 1185 Lower Bellbrook Rd
- 1163 Lower Bellbrook Rd
- 1161 Lower Bellbrook Rd
- 1205 Lower Bellbrook Rd
- 1159 Hedges Rd
- 1211 Lower Bellbrook Rd
- 1105 van Eaton Rd
- 1524 Hawkshead St
- 1512 Hawkshead St
- 1500 Hawkshead St
- 1241 Lower Bellbrook Rd
- 1127 Lower Bellbrook Rd
- 1496 Hawkshead St
- 1492 Hawkshead St
- 1140 Hedges Rd
- 84 Camden Ln
- 1093 van Eaton Rd
- 1115 Lower Bellbrook Rd
- 1251 Lower Bellbrook Rd