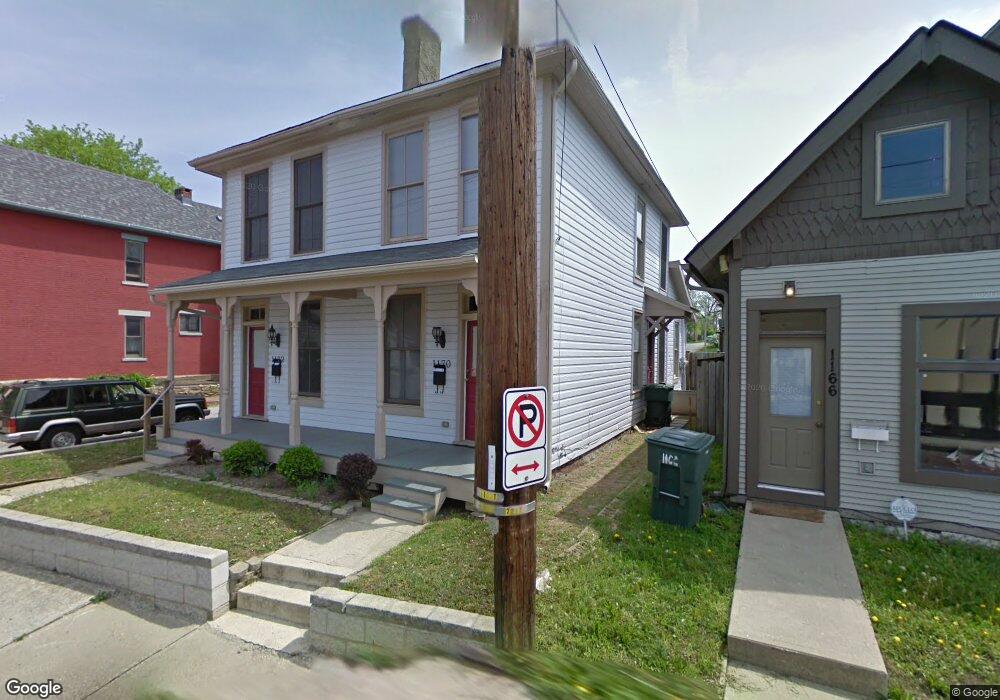
1170 Mount Pleasant Ave Unit 172 Columbus, OH 43201
Italian Village NeighborhoodEstimated Value: $403,000 - $672,000
4
Beds
2
Baths
2,184
Sq Ft
$230/Sq Ft
Est. Value
About This Home
This home is located at 1170 Mount Pleasant Ave Unit 172, Columbus, OH 43201 and is currently estimated at $503,320, approximately $230 per square foot. 1170 Mount Pleasant Ave Unit 172 is a home located in Franklin County with nearby schools including Weinland Park Elementary School, Dominion Middle School, and Whetstone High School.
Ownership History
Date
Name
Owned For
Owner Type
Purchase Details
Closed on
Feb 27, 2004
Sold by
Schilling Nicholas S
Bought by
Nj Mt Pleasant Ltd
Current Estimated Value
Purchase Details
Closed on
Feb 26, 2004
Sold by
Urban Restorations Llc
Bought by
Schilling Nicholas S
Purchase Details
Closed on
Aug 9, 2002
Sold by
Keri Brown Debbie
Bought by
Urban Restorations Llc
Purchase Details
Closed on
Aug 7, 2002
Sold by
St Pachomius Monastary
Bought by
Kere Brown Debbie
Purchase Details
Closed on
Aug 31, 2000
Sold by
Conklin John W and Conklin John
Bought by
Keri Brown Debbie
Purchase Details
Closed on
Jul 12, 1988
Bought by
Conklin John W
Create a Home Valuation Report for This Property
The Home Valuation Report is an in-depth analysis detailing your home's value as well as a comparison with similar homes in the area
Home Values in the Area
Average Home Value in this Area
Purchase History
| Date | Buyer | Sale Price | Title Company |
|---|---|---|---|
| Nj Mt Pleasant Ltd | -- | -- | |
| Schilling Nicholas S | $245,000 | -- | |
| Urban Restorations Llc | $79,900 | Huntington Title Services | |
| Kere Brown Debbie | -- | Huntington Title Services | |
| Keri Brown Debbie | $80,000 | Chicago Title | |
| Conklin John W | $3,500 | -- |
Source: Public Records
Tax History Compared to Growth
Tax History
| Year | Tax Paid | Tax Assessment Tax Assessment Total Assessment is a certain percentage of the fair market value that is determined by local assessors to be the total taxable value of land and additions on the property. | Land | Improvement |
|---|---|---|---|---|
| 2024 | $4,267 | $93,110 | $75,250 | $17,860 |
| 2023 | $6,778 | $149,770 | $75,250 | $74,520 |
| 2022 | $4,762 | $89,610 | $19,850 | $69,760 |
| 2021 | $4,771 | $89,610 | $19,850 | $69,760 |
| 2020 | $5,840 | $109,530 | $19,850 | $89,680 |
| 2019 | $5,045 | $81,140 | $14,700 | $66,440 |
| 2018 | $4,792 | $81,140 | $14,700 | $66,440 |
| 2017 | $5,019 | $81,140 | $14,700 | $66,440 |
| 2016 | $4,994 | $73,510 | $12,360 | $61,150 |
| 2015 | $4,547 | $73,510 | $12,360 | $61,150 |
| 2014 | $4,558 | $73,510 | $12,360 | $61,150 |
| 2013 | $451 | $14,735 | $2,660 | $12,075 |
Source: Public Records
Map
Nearby Homes
- 47 E 4th Ave
- 100 E 4th Ave
- 1105 Say Ave
- 1151 Summit St
- 1149 Summit St
- 1145 N High St Unit 203
- 1145 N High St Unit 307
- 1152 Summit St
- 18 W 4th Ave
- 1136 Summit St
- 30 W 4th Ave
- 1276 N High St Unit 206
- 1276 N High St Unit 402
- 1214 Hamlet St
- 181 E 4th Ave
- 17 W 3rd Ave Unit 212
- 17 W 3rd Ave Unit 213
- 126 E 6th Ave Unit 26
- 63 Smith Place
- 1325 Indianola Ave Unit 325
- 1170 Mount Pleasant Ave Unit 2
- 1164-1166 Mount Pleasant Ave
- 1164 Mount Pleasant Ave Unit 166
- 1178 Mount Pleasant Ave
- 1182 Mount Pleasant Ave
- 44 E 4th Ave
- 46 E 4th Ave
- 1171 Say Ave
- 1163 Say Ave
- 52 E 4th Ave
- 1167 Mount Pleasant Ave
- 1173 Say Ave
- 1159 Say Ave
- 54 E 4th Ave
- 1167 Say Ave
- 58 E 4th Ave
- 60 E 4th Ave Unit 60
- 59 E 5th Ave
- 62 E 4th Ave Unit 64
- 62-64 E 4th Ave