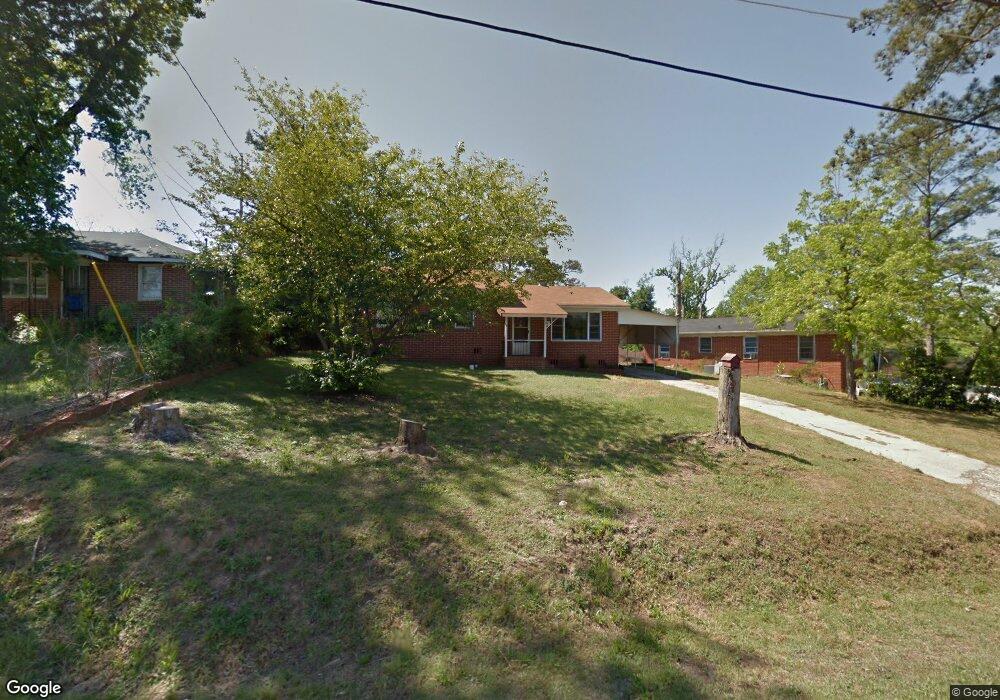
1170 N Beddingfield Dr Macon, GA 31206
Estimated Value: $78,000 - $117,000
3
Beds
2
Baths
1,236
Sq Ft
$83/Sq Ft
Est. Value
About This Home
This home is located at 1170 N Beddingfield Dr, Macon, GA 31206 and is currently estimated at $102,970, approximately $83 per square foot. 1170 N Beddingfield Dr is a home located in Bibb County with nearby schools including Bruce Elementary School, Rutland Middle School, and Rutland High School.
Ownership History
Date
Name
Owned For
Owner Type
Purchase Details
Closed on
May 29, 2024
Sold by
Lanier Property Group I Llc
Bought by
Pitter Invest Llc
Current Estimated Value
Home Financials for this Owner
Home Financials are based on the most recent Mortgage that was taken out on this home.
Original Mortgage
$34,400
Outstanding Balance
$30,876
Interest Rate
7.1%
Mortgage Type
New Conventional
Estimated Equity
$72,094
Purchase Details
Closed on
Dec 27, 2021
Sold by
Brooks Jr James E
Bought by
Lanier Property Group I Llc
Purchase Details
Closed on
Dec 16, 2021
Sold by
Brooks Jr James E
Bought by
Lanier Property Group I Llc
Purchase Details
Closed on
Jun 28, 2013
Sold by
Thompson Walter F and Thompson W
Bought by
Brooks James E
Purchase Details
Closed on
Apr 10, 2012
Sold by
Thompson Edwin Lamar
Bought by
Thompson W F and Thompson Edwin Lamar
Create a Home Valuation Report for This Property
The Home Valuation Report is an in-depth analysis detailing your home's value as well as a comparison with similar homes in the area
Home Values in the Area
Average Home Value in this Area
Purchase History
| Date | Buyer | Sale Price | Title Company |
|---|---|---|---|
| Pitter Invest Llc | $36,000 | None Listed On Document | |
| Lanier Property Group I Llc | -- | None Listed On Document | |
| Lanier Property Group I Llc | $33,460 | C Robin Wyatt Pc | |
| Lanier Property Group I Llc | $33,460 | C Robin Wyatt Pc | |
| Brooks James E | $15,000 | None Available | |
| Thompson W F | -- | None Available |
Source: Public Records
Mortgage History
| Date | Status | Borrower | Loan Amount |
|---|---|---|---|
| Open | Lanier Property Group I Llc | $34,400 | |
| Closed | Lanier Property Group I Llc | $0 |
Source: Public Records
Tax History Compared to Growth
Tax History
| Year | Tax Paid | Tax Assessment Tax Assessment Total Assessment is a certain percentage of the fair market value that is determined by local assessors to be the total taxable value of land and additions on the property. | Land | Improvement |
|---|---|---|---|---|
| 2025 | $1,294 | $52,674 | $2,550 | $50,124 |
| 2024 | $581 | $22,891 | $2,700 | $20,191 |
| 2023 | $678 | $22,891 | $2,700 | $20,191 |
| 2022 | $463 | $20,016 | $2,114 | $17,902 |
| 2021 | $573 | $15,087 | $1,035 | $14,052 |
| 2020 | $389 | $10,014 | $1,035 | $8,979 |
| 2019 | $434 | $11,090 | $1,035 | $10,055 |
| 2018 | $845 | $11,090 | $1,035 | $10,055 |
| 2017 | $277 | $7,401 | $1,035 | $6,366 |
| 2016 | $256 | $7,400 | $1,035 | $6,366 |
| 2015 | $362 | $7,400 | $1,035 | $6,366 |
| 2014 | $338 | $9,676 | $1,774 | $7,903 |
Source: Public Records
Map
Nearby Homes
- 1124 N Beddingfield Dr
- 3811 Lyons St
- 3671 Lyons Place
- 3828 Lyons St
- 1016 W Grenada Terrace
- 3861 Myrtle Ct
- 1254 W Grenada Terrace
- 1290 Pio Nono Cir
- 3975 Guyton St
- 3967 Guyton St
- 4006 Emory Dr
- 1138 Newberg Ave
- 3391 Pio Nono Cir
- 3937 Guyton St
- 3242 Evergreen Dr
- 4071 Marse Allen Rd
- 826 W Grenada Terrace
- 3210 Evergreen Dr
- 1388 Lakeview Cir
- N N Beddingfield Dr
- 3750 N Lyons St
- 1160 N Beddingfield Dr
- 1160 N Beddingfield Dr Unit 24
- 3762 N Lyons St
- 1154 N Beddingfield Dr
- 3730 N Lyons St
- 1148 N Beddingfield Dr
- 3763 N Lyons St
- 1159 N Beddingfield Dr
- 1275 Lyons St
- 1285 Lyons St
- 3963 N Lyons St
- 0 N Beddingfield Dr Unit 8063993
- 0 N Beddingfield Dr
- 3720 N Lyons St
- 0 N Lyons St
- 1243 Lyons St
- 1145 N Beddingfield Dr
- 3781 N Lyons St