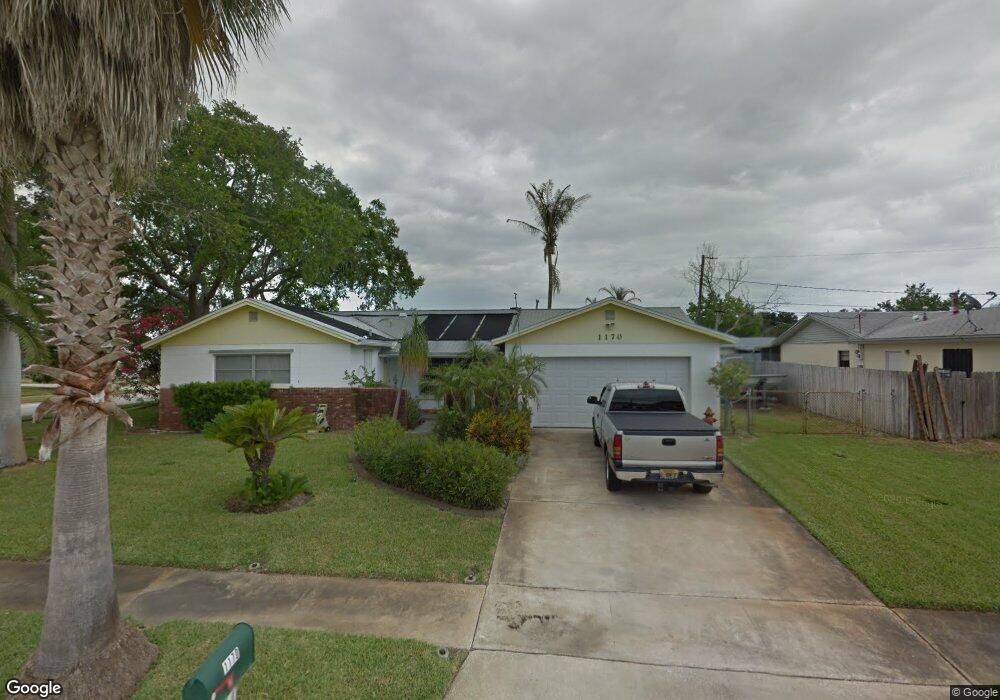
1170 Outrigger Dr Merritt Island, FL 32953
Estimated Value: $358,067 - $381,000
3
Beds
2
Baths
1,487
Sq Ft
$252/Sq Ft
Est. Value
About This Home
This home is located at 1170 Outrigger Dr, Merritt Island, FL 32953 and is currently estimated at $374,017, approximately $251 per square foot. 1170 Outrigger Dr is a home located in Brevard County with nearby schools including Audubon Elementary School, Thomas Jefferson Middle School, and Merritt Island High School.
Ownership History
Date
Name
Owned For
Owner Type
Purchase Details
Closed on
Feb 27, 2018
Sold by
Carter General D and Carter Mitizie P
Bought by
Carter General D and Carter Mitizie P
Current Estimated Value
Purchase Details
Closed on
Feb 12, 2018
Sold by
Carter General D
Bought by
Carter Mitize P
Purchase Details
Closed on
Aug 21, 2000
Sold by
Johnson Harold A
Bought by
Johnson Harold A
Purchase Details
Closed on
May 27, 1999
Sold by
Lindabury Glenda S
Bought by
Carter General D
Home Financials for this Owner
Home Financials are based on the most recent Mortgage that was taken out on this home.
Original Mortgage
$91,200
Interest Rate
6.9%
Purchase Details
Closed on
May 28, 1996
Sold by
Senior Brian P and Senior Barbara A
Bought by
Lindabury Glenda S
Home Financials for this Owner
Home Financials are based on the most recent Mortgage that was taken out on this home.
Original Mortgage
$68,000
Interest Rate
7.93%
Create a Home Valuation Report for This Property
The Home Valuation Report is an in-depth analysis detailing your home's value as well as a comparison with similar homes in the area
Home Values in the Area
Average Home Value in this Area
Purchase History
| Date | Buyer | Sale Price | Title Company |
|---|---|---|---|
| Carter General D | -- | Attorney | |
| Carter Mitize P | $50,000 | Attorney | |
| Johnson Harold A | -- | -- | |
| Carter General D | $98,400 | -- | |
| Lindabury Glenda S | $95,000 | -- |
Source: Public Records
Mortgage History
| Date | Status | Borrower | Loan Amount |
|---|---|---|---|
| Previous Owner | Carter General D | $91,200 | |
| Previous Owner | Lindabury Glenda S | $68,000 |
Source: Public Records
Tax History Compared to Growth
Tax History
| Year | Tax Paid | Tax Assessment Tax Assessment Total Assessment is a certain percentage of the fair market value that is determined by local assessors to be the total taxable value of land and additions on the property. | Land | Improvement |
|---|---|---|---|---|
| 2025 | $1,279 | $94,040 | -- | -- |
| 2024 | $1,245 | $91,390 | -- | -- |
| 2023 | $1,245 | $88,730 | $0 | $0 |
| 2022 | $1,157 | $86,150 | $0 | $0 |
| 2021 | $1,159 | $83,650 | $0 | $0 |
| 2020 | $1,095 | $82,500 | $0 | $0 |
| 2019 | $1,029 | $80,650 | $0 | $0 |
| 2018 | $1,019 | $79,150 | $0 | $0 |
| 2017 | $1,006 | $77,530 | $0 | $0 |
| 2016 | $1,004 | $75,940 | $36,000 | $39,940 |
| 2015 | $1,011 | $75,420 | $30,000 | $45,420 |
| 2014 | $1,012 | $74,830 | $28,000 | $46,830 |
Source: Public Records
Map
Nearby Homes
- 1125 Outrigger Dr
- 330 Jacala Dr
- 325 Wainai Dr
- 1350 Taurus Ct
- 270 Oahu Dr
- 1035 Molaki Dr
- 410 Caracas Dr
- 1370 Scorpious Ct
- 955 Richland Ave
- 1445 Centaurus Ct
- 1445 Taurus Ct
- 1470 Sykes Creek Dr
- 1455 Centaurus Ct
- 900 Richland Ave
- 1380 Mercury St
- 900 Waikiki Dr
- 1525 Sykes Creek Dr
- 875 Waikiki Dr
- 410 Carrioca Ct
- 250 Diana Blvd
- 1160 Outrigger Dr
- 1165 Typhoon Dr
- 1155 Typhoon Dr
- 1165 Outrigger Dr
- 300 Surf Spray Dr
- 1150 Outrigger Dr
- 290 Surf Spray Dr
- 1155 Outrigger Dr
- 1145 Typhoon Dr
- 310 Surf Spray Dr
- 280 Surf Spray Dr
- 1145 Outrigger Dr
- 1140 Outrigger Dr
- 320 Surf Spray Dr
- 1170 Molaki Dr
- 1170 Typhoon Dr
- 1135 Typhoon Dr
- 270 Surf Spray Dr
- 1160 Molaki Dr
- 1160 Typhoon Dr