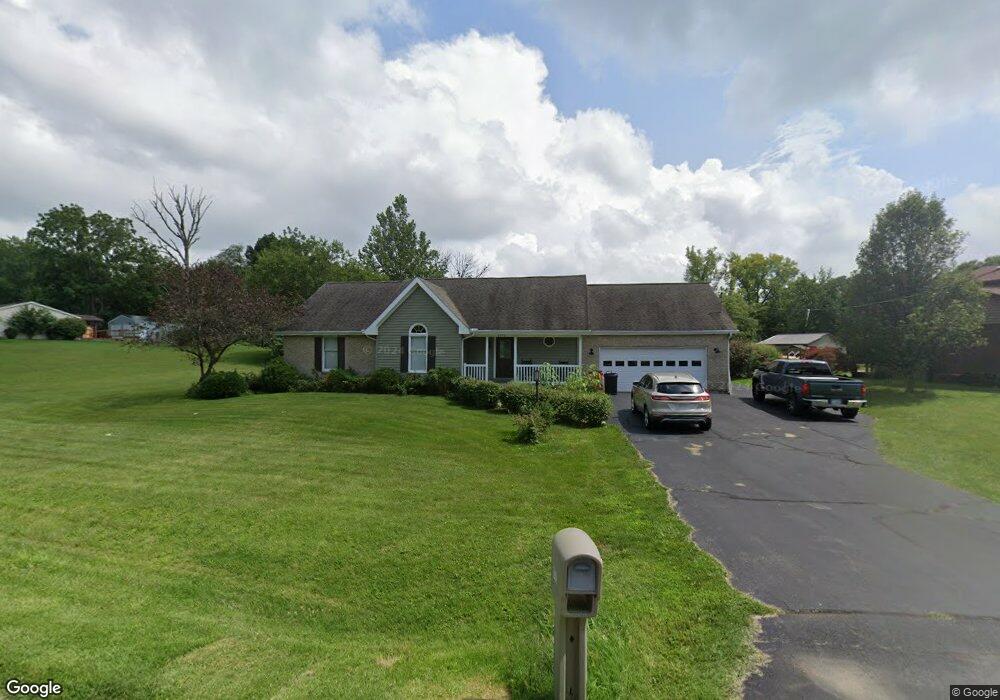
1170 Sylvan Shores Dr South Vienna, OH 45369
Estimated Value: $324,000 - $371,000
3
Beds
2
Baths
1,508
Sq Ft
$228/Sq Ft
Est. Value
About This Home
This home is located at 1170 Sylvan Shores Dr, South Vienna, OH 45369 and is currently estimated at $344,041, approximately $228 per square foot. 1170 Sylvan Shores Dr is a home located in Clark County with nearby schools including Northeastern Elementary School and Northeastern Middle & High School.
Ownership History
Date
Name
Owned For
Owner Type
Purchase Details
Closed on
Sep 7, 2021
Sold by
Fisher Monty G
Bought by
Thompson Brittany and Bailey Marcia
Current Estimated Value
Home Financials for this Owner
Home Financials are based on the most recent Mortgage that was taken out on this home.
Original Mortgage
$270,019
Outstanding Balance
$245,697
Interest Rate
2.8%
Mortgage Type
FHA
Estimated Equity
$98,344
Purchase Details
Closed on
Aug 13, 2004
Sold by
Bay Capital Corp
Bought by
Fisher Joan G and Fisher Monty G
Purchase Details
Closed on
Feb 4, 2002
Sold by
Chatfield Michael D and Chatfield Shannon M
Bought by
Flannery Scott A
Home Financials for this Owner
Home Financials are based on the most recent Mortgage that was taken out on this home.
Original Mortgage
$133,878
Interest Rate
7.24%
Mortgage Type
FHA
Purchase Details
Closed on
Jul 11, 1997
Sold by
Collins Charles E
Bought by
Chatfield Michael D and Chatfield Shannon
Home Financials for this Owner
Home Financials are based on the most recent Mortgage that was taken out on this home.
Original Mortgage
$114,000
Interest Rate
8%
Mortgage Type
New Conventional
Create a Home Valuation Report for This Property
The Home Valuation Report is an in-depth analysis detailing your home's value as well as a comparison with similar homes in the area
Home Values in the Area
Average Home Value in this Area
Purchase History
| Date | Buyer | Sale Price | Title Company |
|---|---|---|---|
| Thompson Brittany | $275,000 | Team Ttl & Closing Svcs Llc | |
| Fisher Joan G | $140,000 | -- | |
| Flannery Scott A | $136,000 | -- | |
| Chatfield Michael D | $129,000 | -- |
Source: Public Records
Mortgage History
| Date | Status | Borrower | Loan Amount |
|---|---|---|---|
| Open | Thompson Brittany | $270,019 | |
| Previous Owner | Flannery Scott A | $133,878 | |
| Previous Owner | Chatfield Michael D | $114,000 |
Source: Public Records
Tax History Compared to Growth
Tax History
| Year | Tax Paid | Tax Assessment Tax Assessment Total Assessment is a certain percentage of the fair market value that is determined by local assessors to be the total taxable value of land and additions on the property. | Land | Improvement |
|---|---|---|---|---|
| 2024 | $2,743 | $65,460 | $9,510 | $55,950 |
| 2023 | $2,743 | $65,460 | $9,510 | $55,950 |
| 2022 | $2,754 | $65,460 | $9,510 | $55,950 |
| 2021 | $2,084 | $50,750 | $7,370 | $43,380 |
| 2020 | $2,086 | $50,750 | $7,370 | $43,380 |
| 2019 | $2,126 | $50,750 | $7,370 | $43,380 |
| 2018 | $1,924 | $45,510 | $5,960 | $39,550 |
| 2017 | $1,644 | $45,511 | $5,961 | $39,550 |
| 2016 | $1,632 | $45,511 | $5,961 | $39,550 |
| 2015 | $805 | $43,743 | $5,733 | $38,010 |
| 2014 | $1,610 | $43,743 | $5,733 | $38,010 |
| 2013 | $1,606 | $43,743 | $5,733 | $38,010 |
Source: Public Records
Map
Nearby Homes
- 935 Sylvan Shores Dr
- 1196 George Allen Dr
- 1026 George Allen Dr
- 0 N Urbana Lisbon Rd
- 13183 E National Rd
- 0 Vernon Asbury Rd Unit 11585913
- 2321 N Houston
- 2367 N Houston Pike
- 711 Wilson Rd
- 12100 Collins Arbogast Rd
- 561 Buena Vista Rd
- 3003 Vernon Asbury Rd
- 7390 Rebecca Dr
- 108 Markley Rd
- 1990 S Buena Vista Rd
- 1142 Big Hill Rd
- 1152 Sylvan Shores Dr
- 1122 Sylvan Shores Dr
- 1226 Sylvan Shores Dr
- 1163 Sylvan Shores Dr
- 1199 Sylvan Shores Dr
- 1145 Sylvan Shores Dr
- 1254 Sylvan Shores Dr
- 1251 Sylvan Shores Dr
- 1070 Sylvan Shores Dr
- 1127 Sylvan Shores Dr
- 1091 Sylvan Shores Dr
- 1277 Sylvan Shores Dr
- 1050 Sylvan Shores Dr
- 1028 Sylvan Shores Dr
- 1028 Sylvan Shores Dr
- 1305 Sylvan Shores Dr
- 1352 Sylvan Shores Dr
- 1325 Sylvan Shores Dr
- 1300 Sylvan Shores Dr
- 1363 Sylvan Shores Dr