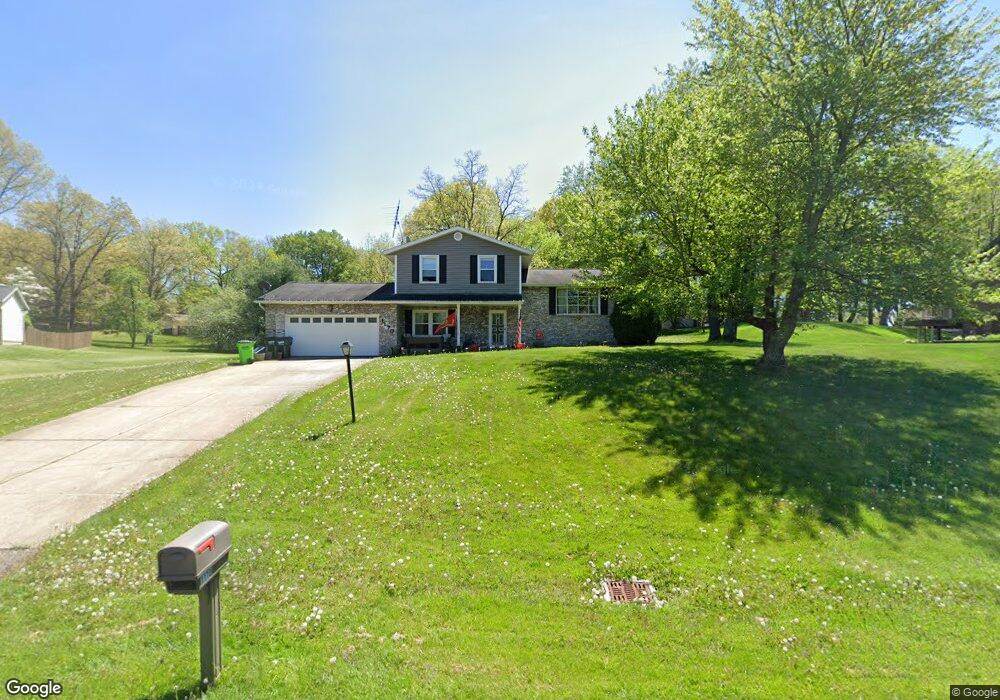
1170 Tumbleweed St NE Uniontown, OH 44685
Estimated Value: $270,174 - $364,000
3
Beds
2
Baths
1,232
Sq Ft
$241/Sq Ft
Est. Value
About This Home
This home is located at 1170 Tumbleweed St NE, Uniontown, OH 44685 and is currently estimated at $296,794, approximately $240 per square foot. 1170 Tumbleweed St NE is a home located in Stark County with nearby schools including Lake Middle/High School and Lake Center Christian School.
Ownership History
Date
Name
Owned For
Owner Type
Purchase Details
Closed on
Feb 22, 2008
Sold by
Kelly Jeffery L and Kelly Michelle S
Bought by
Kelly Jeffery L and Kelly Michelle S
Current Estimated Value
Home Financials for this Owner
Home Financials are based on the most recent Mortgage that was taken out on this home.
Original Mortgage
$163,821
Outstanding Balance
$101,646
Interest Rate
5.75%
Mortgage Type
Stand Alone Refi Refinance Of Original Loan
Estimated Equity
$195,148
Purchase Details
Closed on
Jun 22, 2005
Sold by
Franco Fred A
Bought by
Kelly Jeffrey and Kelly Michelle
Home Financials for this Owner
Home Financials are based on the most recent Mortgage that was taken out on this home.
Original Mortgage
$125,600
Interest Rate
7.75%
Mortgage Type
Fannie Mae Freddie Mac
Purchase Details
Closed on
Jul 17, 1991
Create a Home Valuation Report for This Property
The Home Valuation Report is an in-depth analysis detailing your home's value as well as a comparison with similar homes in the area
Home Values in the Area
Average Home Value in this Area
Purchase History
| Date | Buyer | Sale Price | Title Company |
|---|---|---|---|
| Kelly Jeffery L | -- | Attorney | |
| Kelly Jeffrey | $157,000 | Land America-Lawyers Title | |
| -- | $15,500 | -- |
Source: Public Records
Mortgage History
| Date | Status | Borrower | Loan Amount |
|---|---|---|---|
| Open | Kelly Jeffery L | $163,821 | |
| Closed | Kelly Jeffrey | $125,600 | |
| Closed | Kelly Jeffrey | $31,400 |
Source: Public Records
Tax History Compared to Growth
Tax History
| Year | Tax Paid | Tax Assessment Tax Assessment Total Assessment is a certain percentage of the fair market value that is determined by local assessors to be the total taxable value of land and additions on the property. | Land | Improvement |
|---|---|---|---|---|
| 2025 | -- | $82,530 | $26,180 | $56,350 |
| 2024 | -- | $82,530 | $26,180 | $56,350 |
| 2023 | $3,059 | $65,560 | $16,350 | $49,210 |
| 2022 | $3,069 | $65,560 | $16,350 | $49,210 |
| 2021 | $3,104 | $65,560 | $16,350 | $49,210 |
| 2020 | $3,183 | $60,280 | $14,110 | $46,170 |
| 2019 | $3,154 | $60,280 | $14,110 | $46,170 |
| 2018 | $3,155 | $60,280 | $14,110 | $46,170 |
| 2017 | $2,747 | $48,760 | $14,110 | $34,650 |
| 2016 | $2,752 | $48,760 | $14,110 | $34,650 |
| 2015 | $2,750 | $48,760 | $14,110 | $34,650 |
| 2014 | $369 | $43,720 | $12,640 | $31,080 |
| 2013 | $1,185 | $43,720 | $12,640 | $31,080 |
Source: Public Records
Map
Nearby Homes
- 1037 Canyon St NE
- 747 Grandview Cir
- 786 Fair Vista Cir SW
- 778 Fair Vista Cir SW
- 531 Gentlebrook Blvd SW
- 525 Gentlebrook Blvd SW
- 550 Woodlands Glen Ave
- 12055 King Church Ave NW
- 11121 Geib Ave NE
- 11900 Geib Ave NE
- 510 Meadow Cir SW Unit 11
- 425 Tonawanda Trail SW
- 2084 Hazel St NE
- Unit 9 Meadow Trail SW Unit 9
- 225 Seneca Trail SW
- 1180 Tessa Trail Unit 1180
- 12201 King Church Ave NW
- 1975 Eloise Cir NE
- 1771 Midway St NW
- 330 Belle Ave SW
- 1188 Tumbleweed St NE
- 1150 Tumbleweed St NE
- 1167 Tumbleweed St NE
- 1130 Tumbleweed St NE
- 11291 Bridle Ave NE
- 1210 Tumbleweed St NE
- 11269 Bridle Ave NE
- 11250 Market Ave NE
- 1141 Tumbleweed St NE
- 1185 Tumbleweed St NE
- 1185 Tumbleweed St NE
- 11307 Bridle Ave NE
- 1110 Tumbleweed St NE
- 1125 Tumbleweed St NE
- 1226 Tumbleweed St NE
- 11231 Bridle Ave NE
- 1088 Tumbleweed St NE
- 1270 Saddle St NE
- 11325 Bridle Ave NE
- 11290 Bridle Ave NE