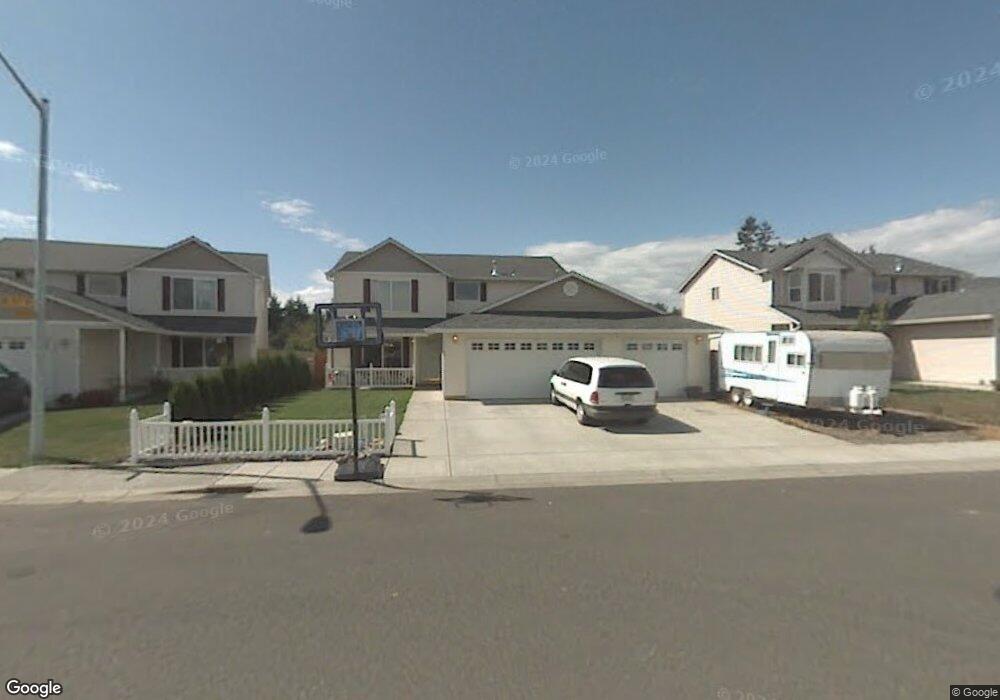
11700 NE 41st Ave Vancouver, WA 98686
Estimated Value: $477,000 - $627,000
4
Beds
3
Baths
2,050
Sq Ft
$261/Sq Ft
Est. Value
About This Home
This home is located at 11700 NE 41st Ave, Vancouver, WA 98686 and is currently estimated at $535,210, approximately $261 per square foot. 11700 NE 41st Ave is a home located in Clark County with nearby schools including Pleasant Valley Primary School, Pleasant Valley Middle School, and Prairie High School.
Ownership History
Date
Name
Owned For
Owner Type
Purchase Details
Closed on
Oct 7, 2021
Sold by
Southerland Roy M and Southerland Elizabeth
Bought by
Southerland Jesse R and Southerland Jacquelyn N
Current Estimated Value
Home Financials for this Owner
Home Financials are based on the most recent Mortgage that was taken out on this home.
Original Mortgage
$394,000
Outstanding Balance
$359,291
Interest Rate
2.8%
Mortgage Type
New Conventional
Estimated Equity
$175,919
Purchase Details
Closed on
May 23, 2003
Sold by
Aho Construction I Inc
Bought by
Southerland Roy M and Southerland Elizabeth
Home Financials for this Owner
Home Financials are based on the most recent Mortgage that was taken out on this home.
Original Mortgage
$175,109
Interest Rate
5.77%
Mortgage Type
FHA
Purchase Details
Closed on
Jan 22, 2003
Sold by
Gaither & Sons Construction Inc
Bought by
Aho Construction I Inc
Create a Home Valuation Report for This Property
The Home Valuation Report is an in-depth analysis detailing your home's value as well as a comparison with similar homes in the area
Home Values in the Area
Average Home Value in this Area
Purchase History
| Date | Buyer | Sale Price | Title Company |
|---|---|---|---|
| Southerland Jesse R | $385,000 | None Available | |
| Southerland Roy M | $177,857 | Stewart Title | |
| Aho Construction I Inc | -- | Chicago Title Insurance |
Source: Public Records
Mortgage History
| Date | Status | Borrower | Loan Amount |
|---|---|---|---|
| Open | Southerland Jesse R | $394,000 | |
| Previous Owner | Southerland Roy M | $175,109 |
Source: Public Records
Tax History Compared to Growth
Tax History
| Year | Tax Paid | Tax Assessment Tax Assessment Total Assessment is a certain percentage of the fair market value that is determined by local assessors to be the total taxable value of land and additions on the property. | Land | Improvement |
|---|---|---|---|---|
| 2025 | $3,810 | $484,926 | $182,000 | $302,926 |
| 2024 | $3,520 | $443,254 | $182,000 | $261,254 |
| 2023 | $3,784 | $498,443 | $182,000 | $316,443 |
| 2022 | $3,394 | $451,671 | $182,000 | $269,671 |
| 2021 | $3,402 | $367,234 | $119,000 | $248,234 |
| 2020 | $3,366 | $333,707 | $109,480 | $224,227 |
| 2019 | $2,876 | $321,546 | $109,480 | $212,066 |
| 2018 | $3,385 | $311,868 | $0 | $0 |
| 2017 | $2,979 | $278,560 | $0 | $0 |
| 2016 | $2,919 | $262,551 | $0 | $0 |
| 2015 | $2,983 | $236,562 | $0 | $0 |
| 2014 | -- | $228,575 | $0 | $0 |
| 2013 | -- | $193,649 | $0 | $0 |
Source: Public Records
Map
Nearby Homes
- 11716 NE 42nd Ct
- 4405 NE 118th St
- 4419 NE 115th St
- 12018 NE 45th Ave
- 11619 NE 36th Ct
- 4600 NE 114th St
- 11410 NE 47th Ct
- 4604 NE 119th St
- 3612 NE 113th St
- 16713 NE 38th Ave
- 16705 NE 38th Ave
- 16709 NE 38th Ave
- 3616 NE 170th St
- 4111 NE 109th Cir
- 11402 NE 51st Ave
- 12207 NE 49th Place
- 11408 NE 51st Ave
- Baker Plan at Pleasant Woods
- Winchester Plan at Pleasant Woods
- Lacey Plan at Pleasant Woods
- 11706 NE 41st Ave
- 11620 NE 41st Ave
- 4009 NE 118th St
- 11618 NE 41st Ave
- 4007 NE 118th St
- 11712 NE 41st Ave
- 4100 NE 117th St
- 4101 NE 117th St
- 11614 NE 41st Ave
- 4005 NE 118th St
- 4104 NE 117th St
- 11800 NE 40th Place
- 11610 NE 41st Ave
- 4105 NE 117th St
- 4001 NE 118th St
- 11713 NE 41st Ave
- 4101 NE 119th St
- 11606 NE 41st Ave
- 11717 NE 41st Ave
- 4108 NE 117th St