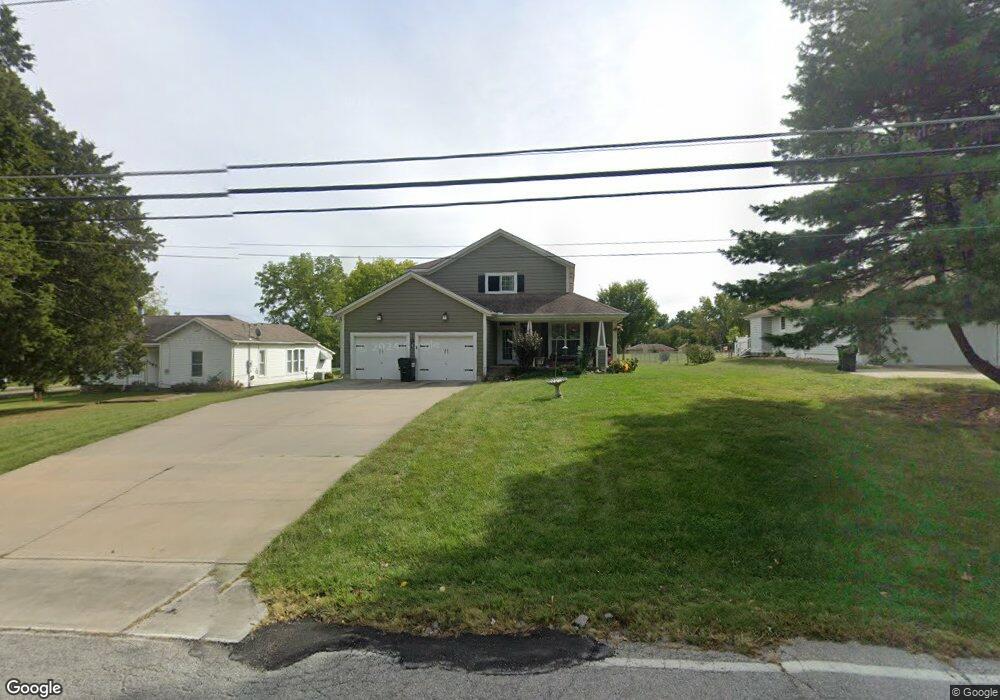
11701 E 75th St Raytown, MO 64138
Estimated Value: $270,000 - $342,000
3
Beds
3
Baths
2,115
Sq Ft
$143/Sq Ft
Est. Value
About This Home
This home is located at 11701 E 75th St, Raytown, MO 64138 and is currently estimated at $302,782, approximately $143 per square foot. 11701 E 75th St is a home located in Jackson County with nearby schools including Robinson Elementary School and Raytown Central Middle School.
Ownership History
Date
Name
Owned For
Owner Type
Purchase Details
Closed on
Jan 10, 2019
Sold by
Melton Lori S and Bryden Lori S
Bought by
Melton Lori S
Current Estimated Value
Home Financials for this Owner
Home Financials are based on the most recent Mortgage that was taken out on this home.
Original Mortgage
$146,500
Outstanding Balance
$129,321
Interest Rate
4.8%
Mortgage Type
New Conventional
Estimated Equity
$173,461
Purchase Details
Closed on
Feb 29, 2008
Sold by
Bryden Michael J
Bought by
Melton Lori S and Bryden Lori S
Home Financials for this Owner
Home Financials are based on the most recent Mortgage that was taken out on this home.
Original Mortgage
$161,000
Interest Rate
5.67%
Mortgage Type
Purchase Money Mortgage
Purchase Details
Closed on
Mar 9, 2007
Sold by
Melton Daryll E
Bought by
Bryden Lori S and Melton Lori S
Home Financials for this Owner
Home Financials are based on the most recent Mortgage that was taken out on this home.
Original Mortgage
$156,000
Interest Rate
6.32%
Mortgage Type
Purchase Money Mortgage
Create a Home Valuation Report for This Property
The Home Valuation Report is an in-depth analysis detailing your home's value as well as a comparison with similar homes in the area
Home Values in the Area
Average Home Value in this Area
Purchase History
| Date | Buyer | Sale Price | Title Company |
|---|---|---|---|
| Melton Lori S | -- | None Available | |
| Melton Lori S | -- | Missouri Secured Title | |
| Bryden Lori S | -- | Missouri Secured Title Lees |
Source: Public Records
Mortgage History
| Date | Status | Borrower | Loan Amount |
|---|---|---|---|
| Open | Melton Lori S | $146,500 | |
| Closed | Melton Lori S | $161,000 | |
| Previous Owner | Bryden Lori S | $156,000 |
Source: Public Records
Tax History
| Year | Tax Paid | Tax Assessment Tax Assessment Total Assessment is a certain percentage of the fair market value that is determined by local assessors to be the total taxable value of land and additions on the property. | Land | Improvement |
|---|---|---|---|---|
| 2025 | $5,828 | $55,028 | $5,406 | $49,622 |
| 2024 | $8,951 | $64,600 | $7,763 | $56,837 |
| 2023 | $8,951 | $99,897 | $9,679 | $90,218 |
| 2022 | $3,914 | $41,610 | $5,411 | $36,199 |
| 2021 | $3,928 | $41,610 | $5,411 | $36,199 |
| 2020 | $3,778 | $39,646 | $5,411 | $34,235 |
| 2019 | $3,758 | $39,646 | $5,411 | $34,235 |
| 2018 | $3,158 | $34,506 | $4,710 | $29,796 |
| 2017 | $3,158 | $34,506 | $4,710 | $29,796 |
| 2016 | $3,062 | $33,641 | $3,327 | $30,314 |
Source: Public Records
Map
Nearby Homes
- 7427 & 7429 Englewood Ln
- 7423 & 7425 Englewood Ln
- 7402 Englewood Ln
- 11800 E 77th St
- 7539 Westridge Rd
- 7606 Woodson Rd
- 11709 E 77th Terrace
- 11605 E 78th St
- 7650 Larson Ave
- 11101 E 72nd Terrace
- 7141 Sterling Ave
- 7824 Westridge Rd
- 7423 Harris Ave
- 7828 Westridge Rd
- 12304 E 78th St
- 12305 E 78th St
- 7317 Hedges Ave
- 7311 Hedges Ave
- 6913 Englewood Ave
- 8001 Westridge Rd Unit 102
- 11615 E 75th St
- 11707 E 75th St
- 11611 E 75th St
- 11710 E 75th St
- 11712 E 75th St
- 11708 E 75th St
- 11804 E 75th St
- 11704 E 75th St
- 11605 E 75th St
- 11810 E 75th St
- 11700 E 75th St
- 11603 E 75th St
- 11709 E 74th Terrace
- 11801 E 74th Terrace
- 11805 E 74th Terrace
- 11608 E 75th St
- 11705 E 74th Terrace
- 11701 E 74th Terrace
- 11609 E 74th Terrace
- 11809 E 74th Terrace
Your Personal Tour Guide
Ask me questions while you tour the home.