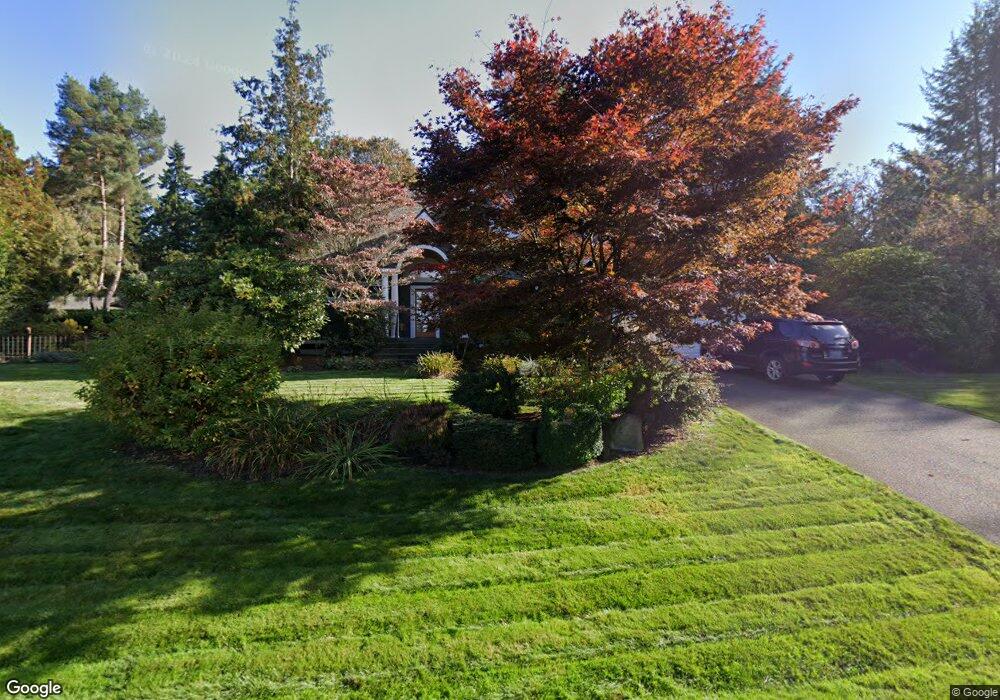
11701 NE Sunset Loop Bainbridge Island, WA 98110
Estimated Value: $991,000 - $1,269,000
3
Beds
3
Baths
2,276
Sq Ft
$523/Sq Ft
Est. Value
About This Home
This home is located at 11701 NE Sunset Loop, Bainbridge Island, WA 98110 and is currently estimated at $1,190,249, approximately $522 per square foot. 11701 NE Sunset Loop is a home located in Kitsap County with nearby schools including Bainbridge High School and The Island School.
Ownership History
Date
Name
Owned For
Owner Type
Purchase Details
Closed on
Nov 9, 2007
Sold by
Lillie Michael A and Lillie Lawrie J
Bought by
Kozlowski Madeline A and Dawson John K
Current Estimated Value
Purchase Details
Closed on
Aug 22, 2005
Sold by
Mowinckel Andres and Mowinckel Marcia L
Bought by
Lillie Michael A and Lillie Lawrie J
Home Financials for this Owner
Home Financials are based on the most recent Mortgage that was taken out on this home.
Original Mortgage
$100,000
Interest Rate
5.61%
Mortgage Type
Fannie Mae Freddie Mac
Purchase Details
Closed on
May 23, 2001
Sold by
Lee George B and Lee Mavis O
Bought by
Mowinckel Andreas and Mowinckel Marcia L
Home Financials for this Owner
Home Financials are based on the most recent Mortgage that was taken out on this home.
Original Mortgage
$317,000
Interest Rate
7.06%
Purchase Details
Closed on
May 25, 1995
Sold by
Oblack Josephine S
Bought by
Lee George B and Lee Mavis O
Create a Home Valuation Report for This Property
The Home Valuation Report is an in-depth analysis detailing your home's value as well as a comparison with similar homes in the area
Home Values in the Area
Average Home Value in this Area
Purchase History
| Date | Buyer | Sale Price | Title Company |
|---|---|---|---|
| Kozlowski Madeline A | $570,280 | Transnation Title Ins Co | |
| Lillie Michael A | $490,280 | Transnation Title | |
| Mowinckel Andreas | $410,000 | Pacific Nw Title | |
| Lee George B | $66,500 | Charter Title Corp |
Source: Public Records
Mortgage History
| Date | Status | Borrower | Loan Amount |
|---|---|---|---|
| Previous Owner | Lillie Michael A | $100,000 | |
| Previous Owner | Mowinckel Andreas | $317,000 |
Source: Public Records
Tax History Compared to Growth
Tax History
| Year | Tax Paid | Tax Assessment Tax Assessment Total Assessment is a certain percentage of the fair market value that is determined by local assessors to be the total taxable value of land and additions on the property. | Land | Improvement |
|---|---|---|---|---|
| 2026 | $8,904 | $1,099,230 | $314,420 | $784,810 |
| 2025 | $8,904 | $1,099,230 | $314,420 | $784,810 |
| 2024 | $8,509 | $1,099,230 | $314,420 | $784,810 |
| 2023 | $8,880 | $1,099,230 | $314,420 | $784,810 |
| 2022 | $7,480 | $786,590 | $239,330 | $547,260 |
| 2021 | $7,352 | $737,450 | $224,090 | $513,360 |
| 2020 | $6,929 | $684,360 | $207,320 | $477,040 |
| 2019 | $6,378 | $641,580 | $193,600 | $447,980 |
| 2018 | $6,211 | $508,400 | $152,440 | $355,960 |
| 2017 | $5,339 | $508,400 | $152,440 | $355,960 |
| 2016 | $5,555 | $503,830 | $135,510 | $368,320 |
| 2015 | $4,938 | $455,790 | $135,510 | $320,280 |
| 2014 | -- | $414,610 | $135,510 | $279,100 |
| 2013 | -- | $414,610 | $135,510 | $279,100 |
Source: Public Records
Map
Nearby Homes
- 11665 NE Sunset Loop
- 11925 Manzanita Ln NE
- 7870 NE Koura Farm Dr
- 11186 Blue Pond Place NE
- 6564 NE Maple St
- 10218 Affirmed Ln NE
- 12145 Arrow Point Loop NE
- 12170 Viewcrest Place NE
- 11000 Xx State Hwy 305 NE
- 13401 Manzanita Rd NE
- 12168 Viewcrest Place NE
- 9631 Summer Hill Ln NE
- 0 NE Lovgreen Rd E Unit NWM2419912
- 13978 Hidden Heights Ln NE
- 9595 Windsong Loop NE
- 9488 Katherine Place NE
- 0 Bucsit Ln NE Unit NWM2416116
- 14157 Komedal Rd NE
- 8003 NE Hidden Cove Rd
- 10052 NE Winther Rd
- 7430 NE Bay Hill Rd
- 11702 NE Sunset Loop
- 11698 NE Sunset Loop
- 7310 NE Bay Hill Rd
- 11694 NE Sunset Loop
- 7468 NE Bay Hill Rd
- 11654 NE Sunset Loop
- 11648 NE Sunset Loop
- 11658 NE Sunset Loop
- 7381 NE Bay Hill Rd
- 11437 Pinyon Ave NE
- 7480 NE Bay Hill Rd
- 11689 NE Sunset Loop
- 7250 NE Bay Hill Rd
- 11688 NE Sunset Loop
- 11687 NE Sunset Loop
- 11668 NE Sunset Loop
- 11440 Pinyon Ave NE
- 7581 NE Bay Hill Rd
- 11653 NE Sunset Loop