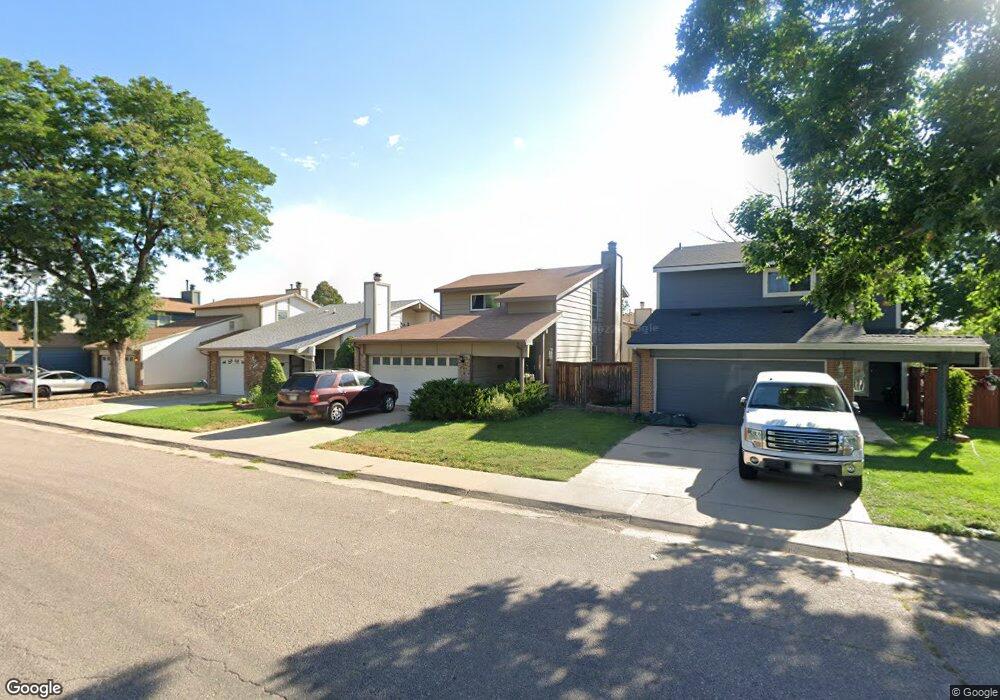
11708 Sherman St Northglenn, CO 80233
Estimated Value: $474,000 - $491,788
4
Beds
3
Baths
2,398
Sq Ft
$200/Sq Ft
Est. Value
About This Home
This home is located at 11708 Sherman St, Northglenn, CO 80233 and is currently estimated at $479,447, approximately $199 per square foot. 11708 Sherman St is a home located in Adams County with nearby schools including Stukey Elementary School, Northglenn Middle School, and Thornton High School.
Ownership History
Date
Name
Owned For
Owner Type
Purchase Details
Closed on
Jun 17, 2019
Sold by
Jones Robin Dee
Bought by
Dennis Jeremy Lincoln and Griffith Fordrena
Current Estimated Value
Home Financials for this Owner
Home Financials are based on the most recent Mortgage that was taken out on this home.
Original Mortgage
$334,650
Outstanding Balance
$294,239
Interest Rate
4.1%
Mortgage Type
New Conventional
Estimated Equity
$185,208
Purchase Details
Closed on
Sep 9, 2016
Sold by
Martin Leslie A
Bought by
Jones Robin Dee
Home Financials for this Owner
Home Financials are based on the most recent Mortgage that was taken out on this home.
Original Mortgage
$258,020
Interest Rate
3.43%
Mortgage Type
New Conventional
Purchase Details
Closed on
Aug 9, 1996
Sold by
Martin Martha N
Bought by
Martin Martha N and Martin Leslie A
Create a Home Valuation Report for This Property
The Home Valuation Report is an in-depth analysis detailing your home's value as well as a comparison with similar homes in the area
Home Values in the Area
Average Home Value in this Area
Purchase History
| Date | Buyer | Sale Price | Title Company |
|---|---|---|---|
| Dennis Jeremy Lincoln | $345,000 | First American | |
| Jones Robin Dee | $270,000 | First American Title | |
| Martin Martha N | -- | -- |
Source: Public Records
Mortgage History
| Date | Status | Borrower | Loan Amount |
|---|---|---|---|
| Open | Dennis Jeremy Lincoln | $334,650 | |
| Previous Owner | Jones Robin Dee | $258,020 |
Source: Public Records
Tax History Compared to Growth
Tax History
| Year | Tax Paid | Tax Assessment Tax Assessment Total Assessment is a certain percentage of the fair market value that is determined by local assessors to be the total taxable value of land and additions on the property. | Land | Improvement |
|---|---|---|---|---|
| 2024 | $3,837 | $30,630 | $5,630 | $25,000 |
| 2023 | $3,802 | $35,850 | $5,410 | $30,440 |
| 2022 | $3,292 | $26,070 | $5,560 | $20,510 |
| 2021 | $3,398 | $26,070 | $5,560 | $20,510 |
| 2020 | $3,024 | $23,670 | $5,720 | $17,950 |
| 2019 | $3,026 | $23,670 | $5,720 | $17,950 |
| 2018 | $2,390 | $18,220 | $5,040 | $13,180 |
| 2017 | $2,200 | $18,220 | $5,040 | $13,180 |
| 2016 | $1,707 | $13,800 | $2,870 | $10,930 |
| 2015 | $1,703 | $13,800 | $2,870 | $10,930 |
| 2014 | $1,605 | $12,670 | $2,470 | $10,200 |
Source: Public Records
Map
Nearby Homes
- 11681 Logan St
- 11723 Quam Dr
- 11584 Community Center Dr Unit 71
- 11718 Keough Dr
- 11840 Clarkson Ct
- 860 Dean Dr
- 11502 Carlile St
- 11816 Spring Dr
- 1081 E 119th Place
- 1469 Dean Dr
- 11855 Humboldt Dr
- 533 W 114th Way
- 380 E 111th Place
- 500 E 111th Place
- 11675 Fowler Dr
- 12222 Bannock Cir Unit F
- 12115 Bannock St Unit B
- 11882 Irma Dr
- 12191 Bannock St Unit C
- 11932 Irma Dr
- 11714 Sherman St
- 11702 Sherman St
- 11720 Sherman St
- 11713 Grant St
- 11707 Grant St
- 11701 Grant St
- 11719 Grant St
- 11726 Sherman St
- 420 E 117th Place
- 11725 Grant St
- 11682 Sherman St
- 11732 Sherman St
- 11731 Grant St
- 414 E 117th Place
- 11725 Sherman St
- 11678 Sherman St
- 11738 Sherman St
- 11737 Grant St
- 11674 Sherman St
- 11731 Sherman St