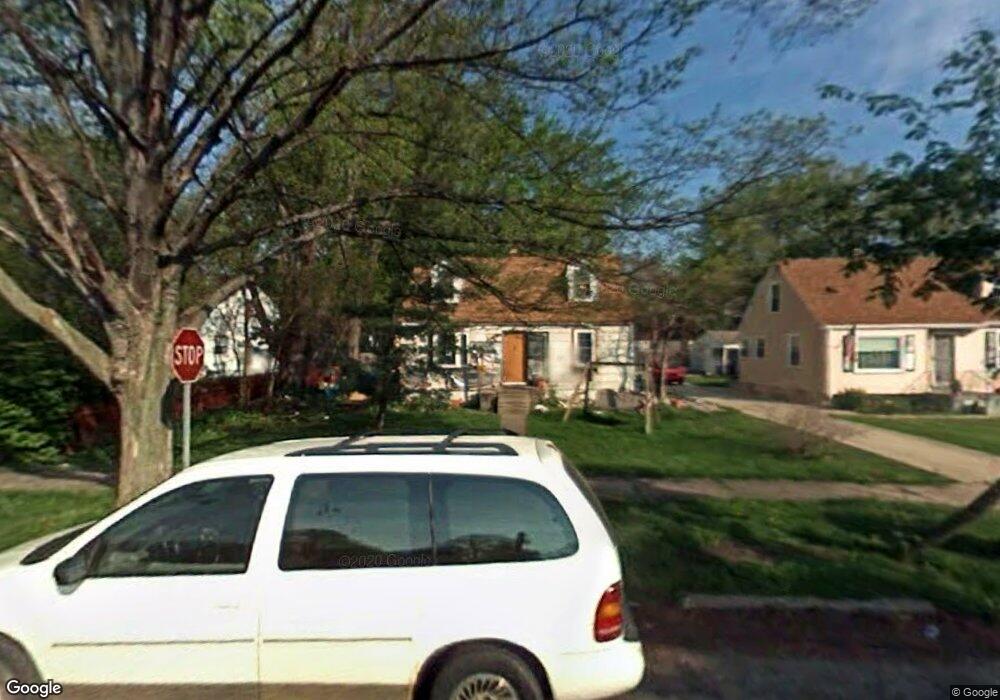
1171 Blyler Place South Bend, IN 46616
Keller Park NeighborhoodEstimated Value: $136,000 - $158,000
3
Beds
2
Baths
1,080
Sq Ft
$135/Sq Ft
Est. Value
About This Home
This home is located at 1171 Blyler Place, South Bend, IN 46616 and is currently estimated at $145,958, approximately $135 per square foot. 1171 Blyler Place is a home located in St. Joseph County with nearby schools including Muessel Primary Center, Clay Intermediate Center, and Jefferson Intermediate Traditional School.
Ownership History
Date
Name
Owned For
Owner Type
Purchase Details
Closed on
Jun 18, 2012
Sold by
Higgins Thomas F
Bought by
Higgins Tomas F and Higgins Lucianita L
Current Estimated Value
Create a Home Valuation Report for This Property
The Home Valuation Report is an in-depth analysis detailing your home's value as well as a comparison with similar homes in the area
Home Values in the Area
Average Home Value in this Area
Purchase History
| Date | Buyer | Sale Price | Title Company |
|---|---|---|---|
| Higgins Tomas F | -- | None Available |
Source: Public Records
Tax History Compared to Growth
Tax History
| Year | Tax Paid | Tax Assessment Tax Assessment Total Assessment is a certain percentage of the fair market value that is determined by local assessors to be the total taxable value of land and additions on the property. | Land | Improvement |
|---|---|---|---|---|
| 2024 | $1,216 | $115,600 | $11,500 | $104,100 |
| 2023 | $667 | $115,800 | $11,500 | $104,300 |
| 2022 | $667 | $88,600 | $11,500 | $77,100 |
| 2021 | $604 | $83,600 | $12,800 | $70,800 |
| 2020 | $263 | $71,000 | $10,900 | $60,100 |
| 2019 | $323 | $71,200 | $11,100 | $60,100 |
| 2018 | $81 | $51,600 | $8,200 | $43,400 |
| 2017 | $106 | $53,500 | $8,200 | $45,300 |
| 2016 | $107 | $53,500 | $8,200 | $45,300 |
| 2014 | $68 | $53,000 | $8,200 | $44,800 |
Source: Public Records
Map
Nearby Homes
- 1029 W Bryan St
- 1922 Berkley Place
- 1113 Beale St
- 1958 Berkley Place
- 1815 Sherman Ave
- 1308 Kinyon St
- 1105 Queen St
- 2237 Hollywood Place
- 248 W Beale St
- 1838 N Brookfield St
- 1710 College St
- 1649 N Adams St
- 1645 N Adams St
- 1738 N Brookfield St
- 1942 N Johnson St
- 1741 N Brookfield St
- 1713 N Brookfield St
- 1602 College St
- 1501 N Adams St
- 1758 Obrien St
- 1167 Blyler Place
- 1207 Culver Place
- 1159 Blyler Place
- 1230 Academy Place
- 1234 Academy Place
- 1222 Academy Place
- 1238 Academy Place
- 1155 Blyler Place
- 1206 Culver Place
- 1218 Academy Place
- 1146 Culver Place
- 1127 Culver Place
- 1246 Academy Place
- 1142 Culver Place
- 1147 Blyler Place
- 1214 Academy Place
- 1134 Culver Place
- 1154 Blyler Place
- 1130 Culver Place
- 1210 Academy Place