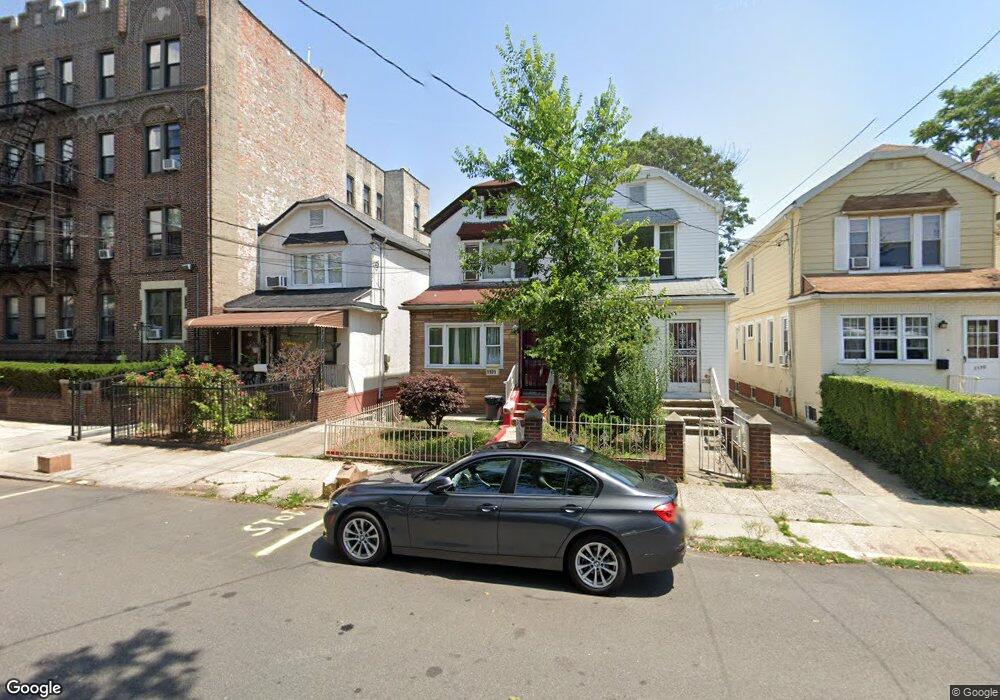
1171 E 35th St Brooklyn, NY 11210
Flatlands NeighborhoodEstimated Value: $721,471 - $1,123,000
Studio
--
Bath
1,280
Sq Ft
$692/Sq Ft
Est. Value
About This Home
This home is located at 1171 E 35th St, Brooklyn, NY 11210 and is currently estimated at $885,368, approximately $691 per square foot. 1171 E 35th St is a home located in Kings County with nearby schools including P.S. 119 Amersfort, Andries Hudde School, and Mesivta Tiferes Yisroel.
Ownership History
Date
Name
Owned For
Owner Type
Purchase Details
Closed on
Mar 8, 2005
Sold by
Daly Elson and Daly Thelma
Bought by
Daly Thelma and Daly William
Current Estimated Value
Purchase Details
Closed on
May 15, 2000
Sold by
Holly Taina Snell
Bought by
Daly Elson and Daly William
Home Financials for this Owner
Home Financials are based on the most recent Mortgage that was taken out on this home.
Original Mortgage
$203,300
Interest Rate
8.55%
Mortgage Type
FHA
Purchase Details
Closed on
Jan 30, 1996
Sold by
American Strategic Income Portfolio Inc
Bought by
Holly Taina Snell and Jeanty Brunel
Home Financials for this Owner
Home Financials are based on the most recent Mortgage that was taken out on this home.
Original Mortgage
$126,750
Interest Rate
7.02%
Mortgage Type
FHA
Purchase Details
Closed on
Nov 29, 1994
Sold by
Grossman Esq Reed
Bought by
American Strategic Income Portfolio Inc
Create a Home Valuation Report for This Property
The Home Valuation Report is an in-depth analysis detailing your home's value as well as a comparison with similar homes in the area
Home Values in the Area
Average Home Value in this Area
Purchase History
| Date | Buyer | Sale Price | Title Company |
|---|---|---|---|
| Daly Thelma | -- | -- | |
| Daly Thelma | -- | -- | |
| Daly Elson | $205,000 | Stewart Title Insurance Co | |
| Daly Elson | $205,000 | Stewart Title Insurance Co | |
| Holly Taina Snell | $131,000 | -- | |
| Holly Taina Snell | $131,000 | -- | |
| American Strategic Income Portfolio Inc | -- | -- | |
| American Strategic Income Portfolio Inc | -- | -- |
Source: Public Records
Mortgage History
| Date | Status | Borrower | Loan Amount |
|---|---|---|---|
| Previous Owner | Daly Elson | $203,300 | |
| Previous Owner | Holly Taina Snell | $126,750 | |
| Closed | Daly Thelma | $0 |
Source: Public Records
Tax History
| Year | Tax Paid | Tax Assessment Tax Assessment Total Assessment is a certain percentage of the fair market value that is determined by local assessors to be the total taxable value of land and additions on the property. | Land | Improvement |
|---|---|---|---|---|
| 2025 | $6,905 | $36,900 | $10,080 | $26,820 |
| 2024 | $6,905 | $38,160 | $10,080 | $28,080 |
| 2023 | $6,587 | $36,900 | $10,080 | $26,820 |
| 2022 | $6,109 | $38,700 | $10,080 | $28,620 |
| 2021 | $6,280 | $34,980 | $10,080 | $24,900 |
| 2020 | $6,386 | $42,000 | $10,080 | $31,920 |
| 2019 | $5,987 | $42,000 | $10,080 | $31,920 |
| 2018 | $5,510 | $27,030 | $7,911 | $19,119 |
| 2017 | $5,198 | $25,500 | $10,080 | $15,420 |
| 2016 | $5,026 | $25,140 | $10,080 | $15,060 |
| 2015 | $3,138 | $25,684 | $10,214 | $15,470 |
| 2014 | $3,138 | $24,231 | $9,637 | $14,594 |
Source: Public Records
Map
Nearby Homes
- 1229 E 37th St
- 1202 E 38th St
- 1182 E 35th St
- 3412 Avenue J
- 3402 Avenue J
- 1746 Flatbush Ave
- 1742 Flatbush Ave
- 1144 E 37th St
- 1810 Avenue N Unit 4C
- 1810 Avenue N Unit 2F
- 1153 E 40th St
- 4019 Avenue K
- 1708 Flatbush Ave
- 973 E 32nd St
- 1046 E 32nd St
- 1327 E 34th St
- 3206 Avenue K
- 1992 New York Ave
- 3523 Avenue I
- 3517 Avenue I
- 1169 E 35th St
- 1173 E 35th St
- 1171 E 35 St
- 1175 E 35th St
- 1155 E 35th St
- 1155 E 35th St Unit 20 a
- 1155 E 35th St
- 1155 E 35th St Unit a005
- 1155 E 35th St Unit a19
- 1155 E 35th St Unit B10
- 1155 E 35th St Unit a5
- 1155 E 35th St Unit 20a
- 1155 E 35th St Unit 16b
- 1155 E 35th St Unit A20
- 1155 E 35th St Unit B20
- 1155 E 35th St Unit B16
- 1155 E 35th St Unit A8
- 1155 E 35th St Unit B6
- 1155 E 35th St Unit 4B
- 1155 E 35th St Unit B4
Your Personal Tour Guide
Ask me questions while you tour the home.