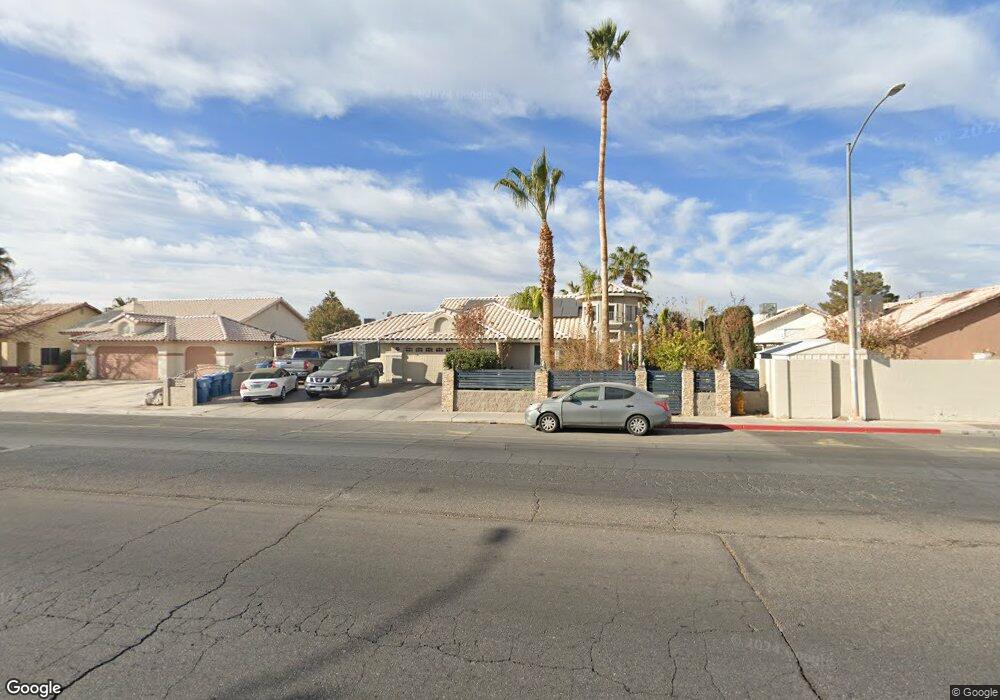
1171 N Christy Ln Las Vegas, NV 89110
Estimated Value: $539,854 - $576,000
5
Beds
3
Baths
2,526
Sq Ft
$221/Sq Ft
Est. Value
About This Home
This home is located at 1171 N Christy Ln, Las Vegas, NV 89110 and is currently estimated at $557,714, approximately $220 per square foot. 1171 N Christy Ln is a home located in Clark County with nearby schools including Stanford Elementary School, Duane D. Keller Middle School, and Eldorado High School.
Ownership History
Date
Name
Owned For
Owner Type
Purchase Details
Closed on
Jan 17, 2003
Sold by
Garcia Cesar A and Garcia Leticia
Bought by
Garcia Cesar A and Garcia Leticia C
Current Estimated Value
Home Financials for this Owner
Home Financials are based on the most recent Mortgage that was taken out on this home.
Original Mortgage
$147,000
Interest Rate
5.97%
Purchase Details
Closed on
Mar 11, 2002
Sold by
Garcia Cesar A and Garcia Leticia
Bought by
Garcia Cesar A and Garcia Leticia
Home Financials for this Owner
Home Financials are based on the most recent Mortgage that was taken out on this home.
Original Mortgage
$99,796
Interest Rate
7.13%
Mortgage Type
FHA
Purchase Details
Closed on
Nov 14, 1995
Sold by
Whitehouse Donald Wayne and Whitehouse Nancy Jean
Bought by
Garcia Cesar A and Garcia Leticia C
Home Financials for this Owner
Home Financials are based on the most recent Mortgage that was taken out on this home.
Original Mortgage
$121,217
Interest Rate
7%
Mortgage Type
FHA
Create a Home Valuation Report for This Property
The Home Valuation Report is an in-depth analysis detailing your home's value as well as a comparison with similar homes in the area
Home Values in the Area
Average Home Value in this Area
Purchase History
| Date | Buyer | Sale Price | Title Company |
|---|---|---|---|
| Garcia Cesar A | -- | United Title Of Nevada | |
| Garcia Cesar A | -- | United Title | |
| Garcia Cesar A | -- | United Title |
Source: Public Records
Mortgage History
| Date | Status | Borrower | Loan Amount |
|---|---|---|---|
| Closed | Garcia Cesar A | $147,000 | |
| Closed | Garcia Cesar A | $99,796 | |
| Previous Owner | Garcia Cesar A | $121,217 |
Source: Public Records
Tax History Compared to Growth
Tax History
| Year | Tax Paid | Tax Assessment Tax Assessment Total Assessment is a certain percentage of the fair market value that is determined by local assessors to be the total taxable value of land and additions on the property. | Land | Improvement |
|---|---|---|---|---|
| 2025 | $2,181 | $122,503 | $30,100 | $92,403 |
| 2024 | $2,118 | $122,503 | $30,100 | $92,403 |
| 2023 | $2,118 | $118,264 | $30,800 | $87,464 |
| 2022 | $2,254 | $105,247 | $24,850 | $80,397 |
| 2021 | $2,139 | $99,921 | $23,450 | $76,471 |
| 2020 | $1,935 | $98,793 | $22,750 | $76,043 |
| 2019 | $1,814 | $94,658 | $19,250 | $75,408 |
| 2018 | $1,731 | $89,003 | $16,800 | $72,203 |
| 2017 | $2,560 | $87,293 | $14,000 | $73,293 |
| 2016 | $1,621 | $82,371 | $8,750 | $73,621 |
| 2015 | $1,617 | $57,607 | $7,000 | $50,607 |
| 2014 | $1,570 | $51,929 | $7,000 | $44,929 |
Source: Public Records
Map
Nearby Homes
- 5383 E Washington Ave
- 1139 Betty Ln
- 1135 Carefree Peak Ct
- 1345 Stokes St
- 5717 Christchurch Ave
- 5754 Cinnabar Ave
- 5802 Queenstown Way
- 5772 Cinnabar Ave
- 1385 Ringe Ln
- 0 Washington Unit 2360795
- 4541 E Owens Ave
- 5843 Dew Mist Ln
- 5923 Halehaven Dr
- 730 N Christy Ln
- 5801 Sunny Orchard Ln
- 910 N Sloan Ln Unit 201
- 1667 Rockwell Ln
- 741 Round Table Dr
- 4932 E Washington Ave
- 656 N Christy Ln
- 1159 N Christy Ln
- 5495 E Washington Ave
- 1170 Timber Ridge Ct
- 5471 E Washington Ave
- 5463 E Washington Ave
- 1146 Timber Ridge Ct
- 2228 N Christy Ln
- 2276 N Christy Ln
- 0 N Christy Ln
- 1135 N Christy Ln
- 5459 E Washington Ave
- 1134 Timber Ridge Ct
- 1169 Timber Ridge Ct
- 1157 Timber Ridge Ct
- 1123 N Christy Ln
- 1147 Timber Ridge Ct
- 1122 Timber Ridge Ct
- 5447 E Washington Ave
- 5503 Snoring Ct