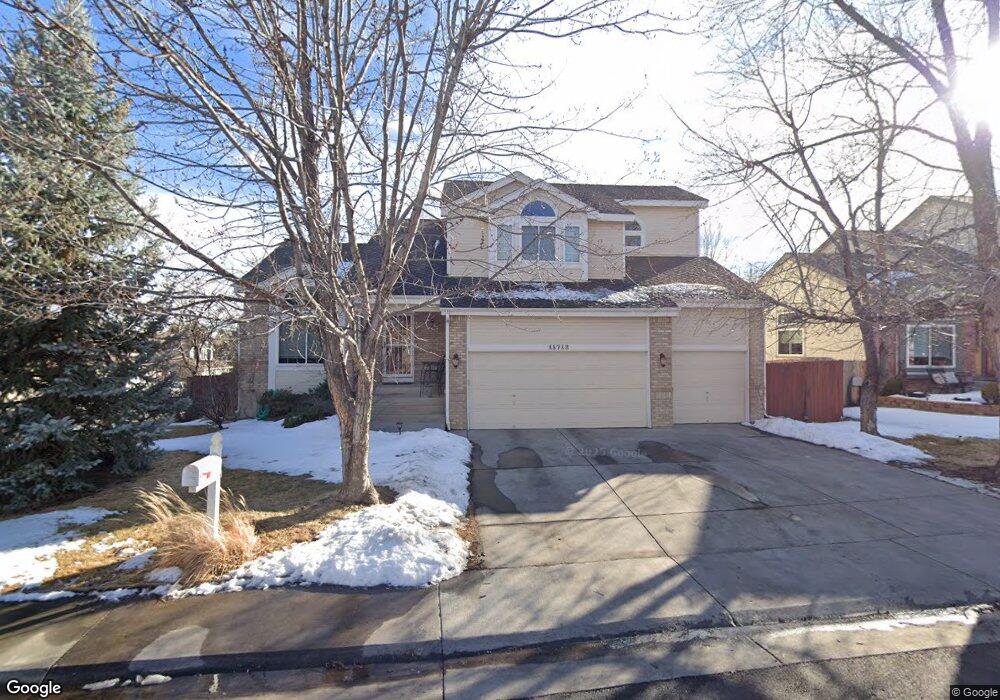
11712 W 75th Cir Arvada, CO 80005
Harvest Lane NeighborhoodEstimated Value: $724,000 - $837,000
4
Beds
3
Baths
3,208
Sq Ft
$243/Sq Ft
Est. Value
About This Home
This home is located at 11712 W 75th Cir, Arvada, CO 80005 and is currently estimated at $779,142, approximately $242 per square foot. 11712 W 75th Cir is a home located in Jefferson County with nearby schools including Fremont Elementary School, Oberon Middle School, and Arvada West High School.
Ownership History
Date
Name
Owned For
Owner Type
Purchase Details
Closed on
Apr 19, 2016
Sold by
Nichols Richard D and Nichols Barbara S
Bought by
Rothert James B
Current Estimated Value
Home Financials for this Owner
Home Financials are based on the most recent Mortgage that was taken out on this home.
Original Mortgage
$364,400
Outstanding Balance
$289,494
Interest Rate
3.68%
Mortgage Type
New Conventional
Estimated Equity
$489,648
Purchase Details
Closed on
Sep 9, 1993
Sold by
Spring Creek Homes
Bought by
Nichols Richard D and Nichols Barbara S
Home Financials for this Owner
Home Financials are based on the most recent Mortgage that was taken out on this home.
Original Mortgage
$167,600
Interest Rate
7.23%
Create a Home Valuation Report for This Property
The Home Valuation Report is an in-depth analysis detailing your home's value as well as a comparison with similar homes in the area
Home Values in the Area
Average Home Value in this Area
Purchase History
| Date | Buyer | Sale Price | Title Company |
|---|---|---|---|
| Rothert James B | $455,500 | None Available | |
| Nichols Richard D | $186,300 | -- |
Source: Public Records
Mortgage History
| Date | Status | Borrower | Loan Amount |
|---|---|---|---|
| Open | Rothert James B | $364,400 | |
| Previous Owner | Nichols Richard D | $167,600 |
Source: Public Records
Tax History Compared to Growth
Tax History
| Year | Tax Paid | Tax Assessment Tax Assessment Total Assessment is a certain percentage of the fair market value that is determined by local assessors to be the total taxable value of land and additions on the property. | Land | Improvement |
|---|---|---|---|---|
| 2024 | $4,519 | $46,585 | $15,135 | $31,450 |
| 2023 | $4,519 | $46,585 | $15,135 | $31,450 |
| 2022 | $4,040 | $41,257 | $11,449 | $29,808 |
| 2021 | $4,107 | $42,445 | $11,779 | $30,666 |
| 2020 | $3,805 | $39,434 | $11,025 | $28,409 |
| 2019 | $3,646 | $38,302 | $11,025 | $27,277 |
| 2018 | $3,270 | $33,398 | $8,261 | $25,137 |
| 2017 | $2,994 | $33,398 | $8,261 | $25,137 |
| 2016 | $3,191 | $33,531 | $8,696 | $24,835 |
| 2015 | $2,863 | $33,531 | $8,696 | $24,835 |
| 2014 | $2,863 | $28,276 | $8,010 | $20,266 |
Source: Public Records
Map
Nearby Homes
- 7482 Routt Ln
- 7454 Queen Cir
- 11854 W 76th Ln
- 11825 W 73rd Dr
- 11290 W 77th Dr
- 11802 W 77th Dr
- 7255 Taft Ct
- 11495 W 77th Dr
- 7130 Simms St Unit 207
- 7631 Oak St
- 8055 Simms St
- 7080 Simms St Unit 204
- 7587 Wright Ct
- 7154 Welch Ct
- 12871 W 74th Dr
- 7049 Van Gordon Ct
- 12940 W 75th Ave
- 13023 W 75th Place
- 10512 W 75th Ave
- 7097 Parfet St
- 11732 W 75th Cir
- 11711 W 75th Dr
- 11731 W 75th Dr
- 7528 Swadley St
- 11752 W 75th Cir
- 7524 Swadley St
- 11703 W 75th Cir
- 11713 W 75th Cir
- 11751 W 75th Dr
- 11693 W 75th Cir
- 7518 Swadley St
- 11733 W 75th Cir
- 11772 W 75th Cir
- 11683 W 75th Cir
- 11672 W 75th Cir
- 11771 W 75th Dr
- 7514 Swadley St
- 11753 W 75th Cir
- 11710 W 75th Dr
- 11673 W 75th Cir