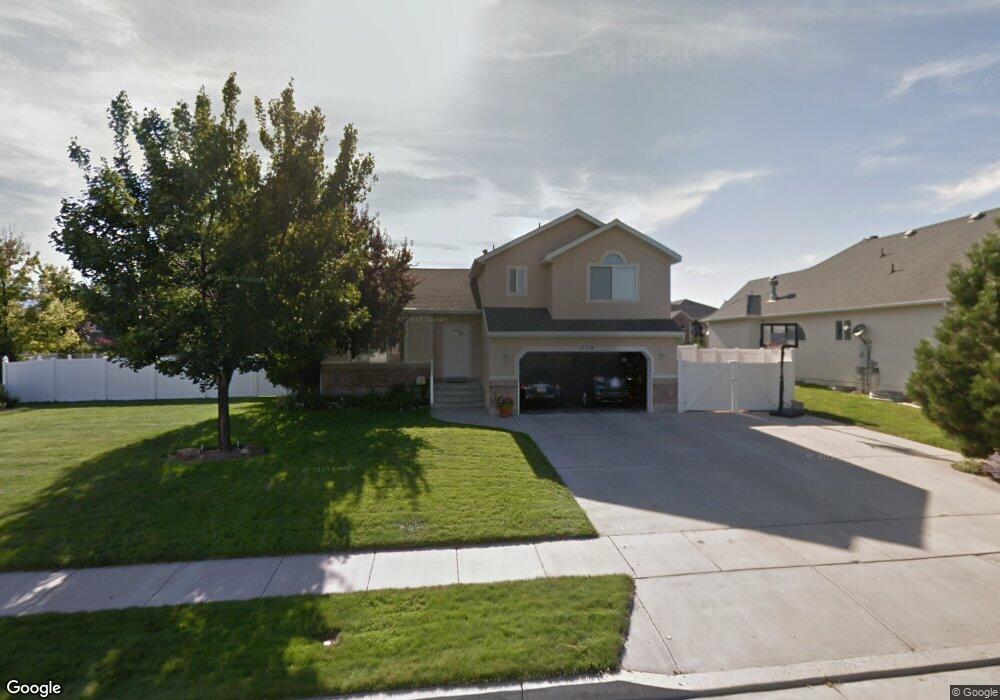
11714 S 4380 W South Jordan, UT 84095
Daybreak NeighborhoodEstimated Value: $489,000 - $636,000
3
Beds
2
Baths
2,107
Sq Ft
$277/Sq Ft
Est. Value
About This Home
This home is located at 11714 S 4380 W, South Jordan, UT 84095 and is currently estimated at $583,729, approximately $277 per square foot. 11714 S 4380 W is a home located in Salt Lake County with nearby schools including Daybreak Elementary School, Mountain Creek Middle School, and Herriman High School.
Ownership History
Date
Name
Owned For
Owner Type
Purchase Details
Closed on
Jun 26, 2003
Sold by
Anderson Tyler G and Anderson Amy N
Bought by
Dansie Michael S and Dansie Kimberly L
Current Estimated Value
Home Financials for this Owner
Home Financials are based on the most recent Mortgage that was taken out on this home.
Original Mortgage
$133,650
Outstanding Balance
$57,292
Interest Rate
5.37%
Mortgage Type
Purchase Money Mortgage
Estimated Equity
$526,437
Purchase Details
Closed on
Sep 17, 1999
Sold by
Anderson Tyler G and North Amy N
Bought by
Anderson Tyler G and Anderson Amy N
Purchase Details
Closed on
Apr 30, 1999
Sold by
Dumouchel Custom Builders
Bought by
Dumouchel Custom Builders and Dumouchel Louis P
Purchase Details
Closed on
Apr 27, 1999
Sold by
Bg South Jordan Associates Ltd
Bought by
Dumouchel Custom Builders
Create a Home Valuation Report for This Property
The Home Valuation Report is an in-depth analysis detailing your home's value as well as a comparison with similar homes in the area
Home Values in the Area
Average Home Value in this Area
Purchase History
| Date | Buyer | Sale Price | Title Company |
|---|---|---|---|
| Dansie Michael S | -- | Sutherland Title | |
| Anderson Tyler G | -- | Equity Title | |
| Dumouchel Custom Builders | -- | Legacy Land Title | |
| Dumouchel Custom Builders | -- | Legacy Land Title |
Source: Public Records
Mortgage History
| Date | Status | Borrower | Loan Amount |
|---|---|---|---|
| Open | Dansie Michael S | $133,650 | |
| Closed | Dansie Michael S | $33,400 |
Source: Public Records
Tax History Compared to Growth
Tax History
| Year | Tax Paid | Tax Assessment Tax Assessment Total Assessment is a certain percentage of the fair market value that is determined by local assessors to be the total taxable value of land and additions on the property. | Land | Improvement |
|---|---|---|---|---|
| 2025 | $2,695 | $529,000 | $211,700 | $317,300 |
| 2024 | $2,695 | $511,700 | $205,600 | $306,100 |
| 2023 | $2,741 | $491,000 | $197,700 | $293,300 |
| 2022 | $2,845 | $499,600 | $193,800 | $305,800 |
| 2021 | $2,369 | $381,600 | $134,600 | $247,000 |
| 2020 | $2,126 | $321,100 | $114,200 | $206,900 |
| 2019 | $2,141 | $317,800 | $114,200 | $203,600 |
| 2018 | $2,001 | $295,600 | $111,800 | $183,800 |
| 2017 | $1,905 | $275,700 | $111,800 | $163,900 |
| 2016 | $1,849 | $253,600 | $111,800 | $141,800 |
| 2015 | $1,825 | $243,400 | $113,900 | $129,500 |
| 2014 | $1,750 | $229,300 | $108,600 | $120,700 |
Source: Public Records
Map
Nearby Homes
- 4347 W 11770 S
- 4463 W Harvest Sun Ln
- 4454 W 11800 S
- 4466 W 11800 S
- 11777 S 4210 W
- 11491 Harvest Crest Way
- 4536 W Silent Rain Dr
- 4144 W Foxview Dr
- 4555 W Open Hill Dr
- 11768 S Copper Sky Dr
- 11851 S Graycliff Rd
- 11915 Goldsmith Ct
- 11347 S Kestrel Rise Rd
- 12667 S Lincoln Peak Ln
- 12671 S Lincoln Peak Ln
- 12668 S Lincoln Peak Ln Unit 109
- 12687 S Lincoln Peak Ln
- 12674 S Lincoln Peak Ln
- 12674 S Lincoln Peak Ln Unit 111
- 12693 S Lincoln Peak Ln
- 11728 S 4380 W
- 11698 S 4380 W
- 11711 S Harvest Rain Ave
- 11711 Harvest Rain Ave
- 11721 Harvest Rain Ave
- 11713 S 4380 W
- 11699 S Harvest Rain Ave
- 11733 S Harvest Rain Ave
- 11699 Harvest Rain Ave
- 11733 Harvest Rain Ave
- 11697 S 4380 W
- 11729 S 4380 W
- 11744 S 4380 W
- 11743 Harvest Rain Ave
- 11743 S 4380 W
- 11743 S 4380 W Unit 340
- 11674 Scare Crow Ct
- 4392 W Harvest Moon Dr
- 4392 W Harvest Moon Dr
- 4344 Country Crossing Ct