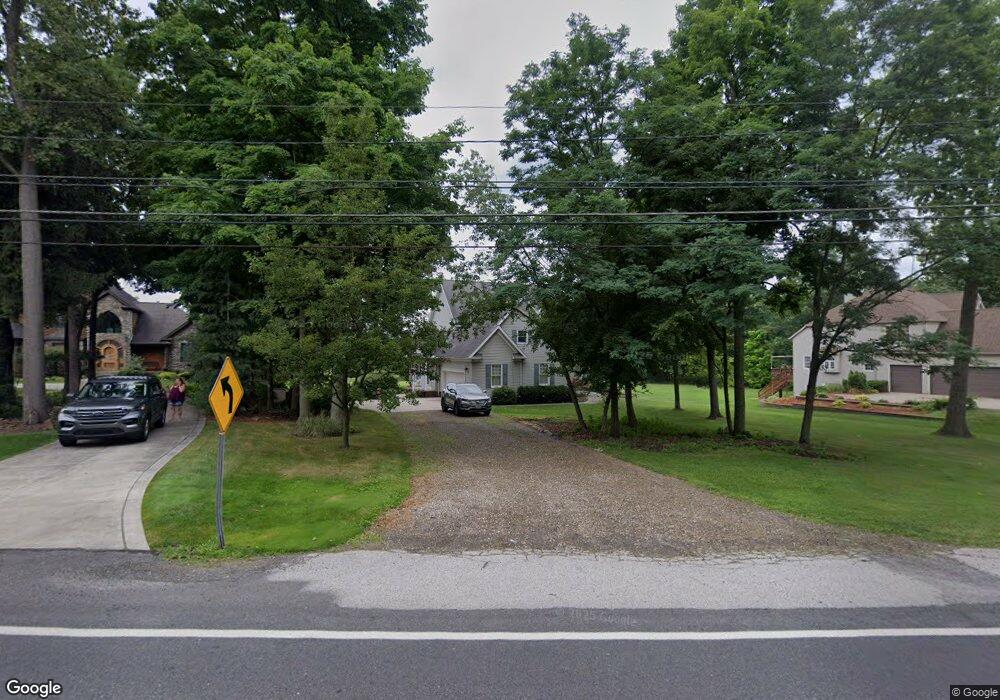
11716 Dunham Rd Northfield, OH 44067
Estimated Value: $534,000 - $596,000
3
Beds
4
Baths
3,306
Sq Ft
$175/Sq Ft
Est. Value
About This Home
This home is located at 11716 Dunham Rd, Northfield, OH 44067 and is currently estimated at $576,940, approximately $174 per square foot. 11716 Dunham Rd is a home located in Summit County with nearby schools including Lee Eaton Elementary School, Nordonia Middle School, and Nordonia High School.
Ownership History
Date
Name
Owned For
Owner Type
Purchase Details
Closed on
Dec 16, 2024
Sold by
Byers Karen Ortenzio
Bought by
Karen Ortenzio Byers Revocable Trust and Byers
Current Estimated Value
Purchase Details
Closed on
Aug 19, 2019
Sold by
Byers Michael W and Byers Karen O
Bought by
Byers Karen O
Home Financials for this Owner
Home Financials are based on the most recent Mortgage that was taken out on this home.
Original Mortgage
$152,000
Interest Rate
3.8%
Mortgage Type
New Conventional
Purchase Details
Closed on
Oct 7, 1996
Sold by
Colonial Forest Estates
Bought by
Byersd Michael W and Byersd Karen O
Home Financials for this Owner
Home Financials are based on the most recent Mortgage that was taken out on this home.
Original Mortgage
$44,250
Interest Rate
8%
Mortgage Type
Balloon
Create a Home Valuation Report for This Property
The Home Valuation Report is an in-depth analysis detailing your home's value as well as a comparison with similar homes in the area
Home Values in the Area
Average Home Value in this Area
Purchase History
| Date | Buyer | Sale Price | Title Company |
|---|---|---|---|
| Karen Ortenzio Byers Revocable Trust | -- | None Listed On Document | |
| Byers Karen O | -- | Quicksilva Title And Escrow | |
| Byersd Michael W | $59,000 | -- |
Source: Public Records
Mortgage History
| Date | Status | Borrower | Loan Amount |
|---|---|---|---|
| Previous Owner | Byers Karen O | $152,000 | |
| Previous Owner | Byersd Michael W | $44,250 |
Source: Public Records
Tax History
| Year | Tax Paid | Tax Assessment Tax Assessment Total Assessment is a certain percentage of the fair market value that is determined by local assessors to be the total taxable value of land and additions on the property. | Land | Improvement |
|---|---|---|---|---|
| 2025 | $9,349 | $183,796 | $38,392 | $145,404 |
| 2024 | $9,349 | $183,796 | $38,392 | $145,404 |
| 2023 | $9,349 | $183,796 | $38,392 | $145,404 |
| 2022 | $8,275 | $131,492 | $27,423 | $104,069 |
| 2021 | $8,110 | $131,492 | $27,423 | $104,069 |
| 2020 | $7,978 | $131,490 | $27,420 | $104,070 |
| 2019 | $7,308 | $107,990 | $26,570 | $81,420 |
| 2018 | $6,388 | $106,960 | $26,570 | $80,390 |
| 2017 | $6,574 | $106,960 | $26,570 | $80,390 |
| 2016 | $6,444 | $106,960 | $26,570 | $80,390 |
| 2015 | $6,574 | $106,960 | $26,570 | $80,390 |
| 2014 | $6,534 | $106,960 | $26,570 | $80,390 |
| 2013 | $6,858 | $113,380 | $26,570 | $86,810 |
Source: Public Records
Map
Nearby Homes
- 11768 Valley View Rd
- 8546 Shorthorn Dr
- 7982 Achill Ct
- 8191 Cyrus Ln
- 7801 Summerset Dr
- 8208 Cyrus Ln
- 1144 Nesbitt Rd
- 321 Stone Bridge Dr
- 7967 N Gannett Rd
- 219 Baptist Cir
- 17759 S Meadowpark Dr
- 256 Monroe Dr
- 307 Washington Dr
- 7360 N Meadowpark Dr
- 8134 N Boyden Rd
- 8683 Pine Creek Ln Unit 15
- 213 Steeple Chase Run Unit 11
- 106 Maple Ave
- 8094 Rolling Brook Rd
- 17304 Egbert Rd
- 11702 Dunham Rd
- 11738 Dunham Rd
- 11692 Dunham Rd
- 11746 Dunham Rd
- 11678 Dunham Rd
- 8517 Rockefeller Ln
- 11739 Dunham Rd
- 11739 Dunham Rd Unit 38322053
- 8491 Rockefeller Ln
- 8503 Rockefeller Ln
- 11756 Dunham Rd
- 11673 Dunham Rd
- 11747 Dunham Rd
- 11670 Dunham Rd
- 8479 Rockefeller Ln
- 11766 Dunham Rd
- 8471 Rockefeller Ln
- 842 Hidden Ridge Dr
- 11662 Dunham Rd
- 8538 Rockefeller Ln
Your Personal Tour Guide
Ask me questions while you tour the home.