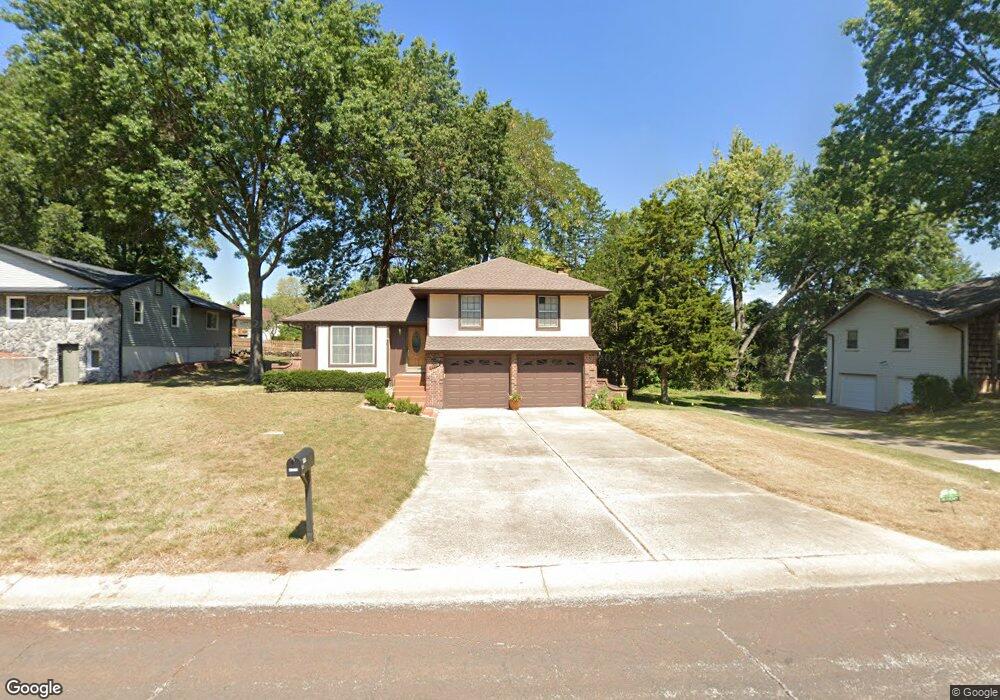
11716 E 77th St Raytown, MO 64138
Estimated Value: $211,000 - $239,000
3
Beds
3
Baths
1,180
Sq Ft
$196/Sq Ft
Est. Value
About This Home
This home is located at 11716 E 77th St, Raytown, MO 64138 and is currently estimated at $230,715, approximately $195 per square foot. 11716 E 77th St is a home located in Jackson County with nearby schools including Robinson Elementary School and Raytown Central Middle School.
Ownership History
Date
Name
Owned For
Owner Type
Purchase Details
Closed on
Sep 27, 2005
Sold by
Wilson Brent A and Wilson Jennifer S
Bought by
Spader Kenneth W
Current Estimated Value
Home Financials for this Owner
Home Financials are based on the most recent Mortgage that was taken out on this home.
Original Mortgage
$100,000
Outstanding Balance
$53,096
Interest Rate
5.73%
Mortgage Type
Fannie Mae Freddie Mac
Estimated Equity
$177,619
Purchase Details
Closed on
Jul 24, 1998
Sold by
Sullivan Cheryl A and Sullivan Cheryl A
Bought by
Wilson Brent A and Wilson Jennifer S
Home Financials for this Owner
Home Financials are based on the most recent Mortgage that was taken out on this home.
Original Mortgage
$80,500
Interest Rate
7.05%
Mortgage Type
Purchase Money Mortgage
Purchase Details
Closed on
Dec 16, 1997
Sold by
Thurston Kenneth S
Bought by
Thurston Cheryl A
Create a Home Valuation Report for This Property
The Home Valuation Report is an in-depth analysis detailing your home's value as well as a comparison with similar homes in the area
Home Values in the Area
Average Home Value in this Area
Purchase History
| Date | Buyer | Sale Price | Title Company |
|---|---|---|---|
| Spader Kenneth W | -- | Kansas City Title | |
| Wilson Brent A | -- | Chicago Title Insurance Co | |
| Thurston Cheryl A | -- | -- |
Source: Public Records
Mortgage History
| Date | Status | Borrower | Loan Amount |
|---|---|---|---|
| Open | Spader Kenneth W | $100,000 | |
| Previous Owner | Wilson Brent A | $80,500 |
Source: Public Records
Tax History
| Year | Tax Paid | Tax Assessment Tax Assessment Total Assessment is a certain percentage of the fair market value that is determined by local assessors to be the total taxable value of land and additions on the property. | Land | Improvement |
|---|---|---|---|---|
| 2025 | $3,135 | $30,153 | $4,484 | $25,669 |
| 2024 | $3,114 | $34,749 | $2,987 | $31,762 |
| 2023 | $3,114 | $34,750 | $4,169 | $30,581 |
| 2022 | $2,145 | $22,800 | $3,506 | $19,294 |
| 2021 | $2,152 | $22,800 | $3,506 | $19,294 |
| 2020 | $2,175 | $22,822 | $3,506 | $19,316 |
| 2019 | $2,163 | $22,822 | $3,506 | $19,316 |
| 2018 | $1,811 | $19,792 | $2,701 | $17,091 |
| 2016 | $1,756 | $19,296 | $2,544 | $16,752 |
Source: Public Records
Map
Nearby Homes
- 11800 E 77th St
- 11605 E 78th St
- 7606 Woodson Rd
- 7828 Westridge Rd
- 7427 & 7429 Englewood Ln
- 7423 & 7425 Englewood Ln
- 12305 E 78th St
- 8001 Westridge Rd Unit 102
- 7520 Lewis Ave
- 7308 Crisp Ave
- 7923 Harris Ave
- 7141 Sterling Ave
- 8132 Sterling Ave
- 10604 E 75th St
- 10601 E 78th Terrace
- 11104 E 83rd Terrace
- 8408 Woodson Ct
- 7420 Hardy Ave
- 8008 Hardy Ave
- 8324 Pershing Rd
- 11708 E 77th St
- 11715 E 76th Terrace
- 11704 E 77th St
- 11801 E 76th Terrace
- 11804 E 77th St
- 11713 E 77th St
- 11715 E 77th St
- 11801 E 77th St
- 11805 E 76th Terrace
- 11712 E 76th Terrace
- 11705 E 77th St
- 11805 E 77th St
- 11705 E 76th Terrace
- 11700 E 77th St
- 11808 E 77th St
- 7700 Irwin Rd
- 11809 E 76th Terrace
- 11701 E 77th St
- 7704 Irwin Rd
- 11701 E 76th Terrace
Your Personal Tour Guide
Ask me questions while you tour the home.