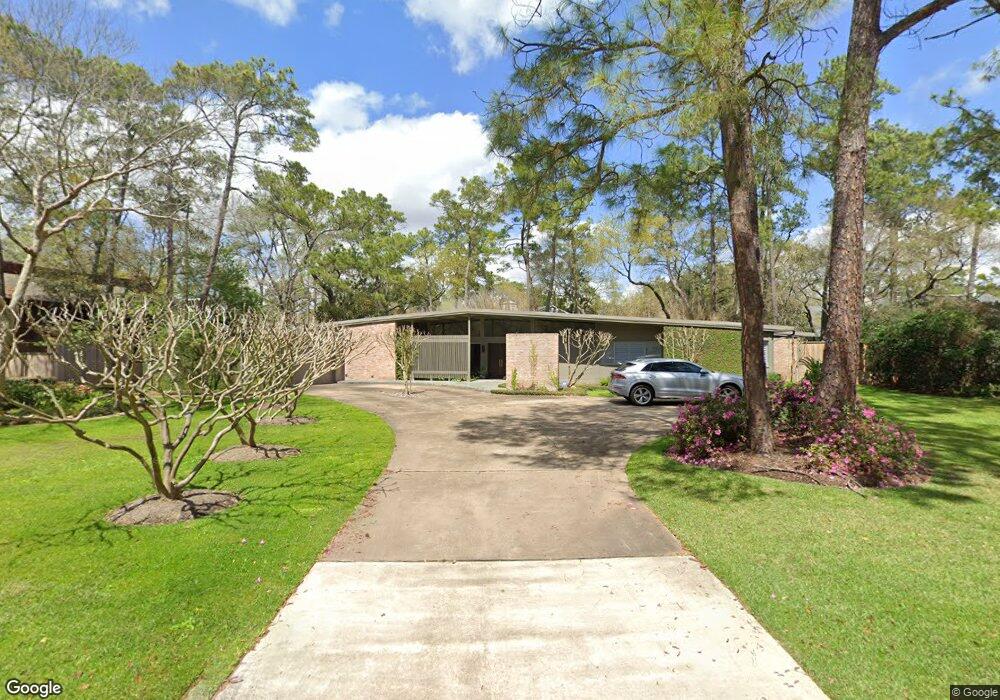
11718 Flintwood Dr Houston, TX 77024
Estimated Value: $1,912,035 - $2,108,000
5
Beds
4
Baths
3,517
Sq Ft
$563/Sq Ft
Est. Value
About This Home
This home is located at 11718 Flintwood Dr, Houston, TX 77024 and is currently estimated at $1,981,345, approximately $563 per square foot. 11718 Flintwood Dr is a home located in Harris County with nearby schools including Spring Branch Middle School, Memorial High School, and St. Cecilia Catholic School.
Ownership History
Date
Name
Owned For
Owner Type
Purchase Details
Closed on
Nov 30, 2005
Sold by
Parsons Paul A and Parsons Jessica L
Bought by
Dukes Daniel M and Dukes Elizabeth M
Current Estimated Value
Home Financials for this Owner
Home Financials are based on the most recent Mortgage that was taken out on this home.
Original Mortgage
$613,800
Outstanding Balance
$338,716
Interest Rate
6.06%
Mortgage Type
Purchase Money Mortgage
Estimated Equity
$1,642,629
Purchase Details
Closed on
Oct 25, 1999
Sold by
Lewis Gail R and Silverman Gail Patricia
Bought by
Parsons Paul A and Parsons Jessica L
Home Financials for this Owner
Home Financials are based on the most recent Mortgage that was taken out on this home.
Original Mortgage
$466,600
Interest Rate
6.87%
Purchase Details
Closed on
Apr 5, 1999
Sold by
Lewis Gail and Walker Gail Lincoln
Bought by
Roland Albert
Create a Home Valuation Report for This Property
The Home Valuation Report is an in-depth analysis detailing your home's value as well as a comparison with similar homes in the area
Home Values in the Area
Average Home Value in this Area
Purchase History
| Date | Buyer | Sale Price | Title Company |
|---|---|---|---|
| Dukes Daniel M | -- | -- | |
| Parsons Paul A | -- | Lawyers Title Company | |
| Roland Albert | -- | -- |
Source: Public Records
Mortgage History
| Date | Status | Borrower | Loan Amount |
|---|---|---|---|
| Open | Dukes Daniel M | $613,800 | |
| Previous Owner | Parsons Paul A | $466,600 | |
| Closed | Parsons Paul A | $58,300 |
Source: Public Records
Tax History Compared to Growth
Tax History
| Year | Tax Paid | Tax Assessment Tax Assessment Total Assessment is a certain percentage of the fair market value that is determined by local assessors to be the total taxable value of land and additions on the property. | Land | Improvement |
|---|---|---|---|---|
| 2025 | $24,342 | $1,909,652 | $1,213,200 | $696,452 |
| 2024 | $24,342 | $1,569,958 | $1,172,760 | $397,198 |
| 2023 | $24,342 | $1,585,955 | $1,112,100 | $473,855 |
| 2022 | $32,646 | $1,573,761 | $1,112,100 | $461,661 |
| 2021 | $30,911 | $1,427,341 | $1,051,440 | $375,901 |
| 2020 | $31,233 | $1,410,270 | $1,051,440 | $358,830 |
| 2019 | $31,306 | $1,357,213 | $1,051,440 | $305,773 |
| 2018 | $7,521 | $1,480,111 | $1,051,440 | $428,671 |
| 2017 | $32,155 | $1,480,111 | $1,051,440 | $428,671 |
| 2016 | $29,231 | $1,480,111 | $1,051,440 | $428,671 |
| 2015 | $19,766 | $1,480,111 | $1,051,440 | $428,671 |
| 2014 | $19,766 | $1,247,395 | $909,900 | $337,495 |
Source: Public Records
Map
Nearby Homes
- 11706 Flintwood Dr
- 9 Leisure Ln
- 4 Blalock Woods St
- 11607 Barazi Oaks Ct
- 517 Flintdale Rd
- 11718 Broken Bough Cir
- 2 Blalock Pines Ct
- 711 Timber Hill Dr
- 11607 Shady Grove Ln
- 710 Glen Echo Ln
- 835 Merridel Rd
- 625 Piney Point Rd
- 11640 Greenbay St
- 8 Jeffers Ct
- 11910 Heritage Ln
- 11407 Holidan Way
- 11729 Joan of Arc Dr
- 12 Gage Ct
- 826 Bunker Hill Rd
- 827 Bunker Hill Rd
- 11722 Flintwood Dr
- 33 Carolane Trail
- 11714 Flintwood Dr
- 37 Carolane Trail
- 11719 Flintwood Dr
- 11715 Flintwood Dr
- 11723 Flintwood Dr
- 11726 Flintwood Dr
- 11715 Wendover Ln
- 29 Carolane Trail
- 11710 Flintwood Dr
- 11711 Flintwood Dr
- 11727 Flintwood Dr
- 34 Carolane Trail
- 11714 Brandon Way
- 41 Carolane Trail
- 11730 Flintwood Dr
- 11707 Wendover Ln
- 22 Carolane Trail
- 25 Carolane Trail