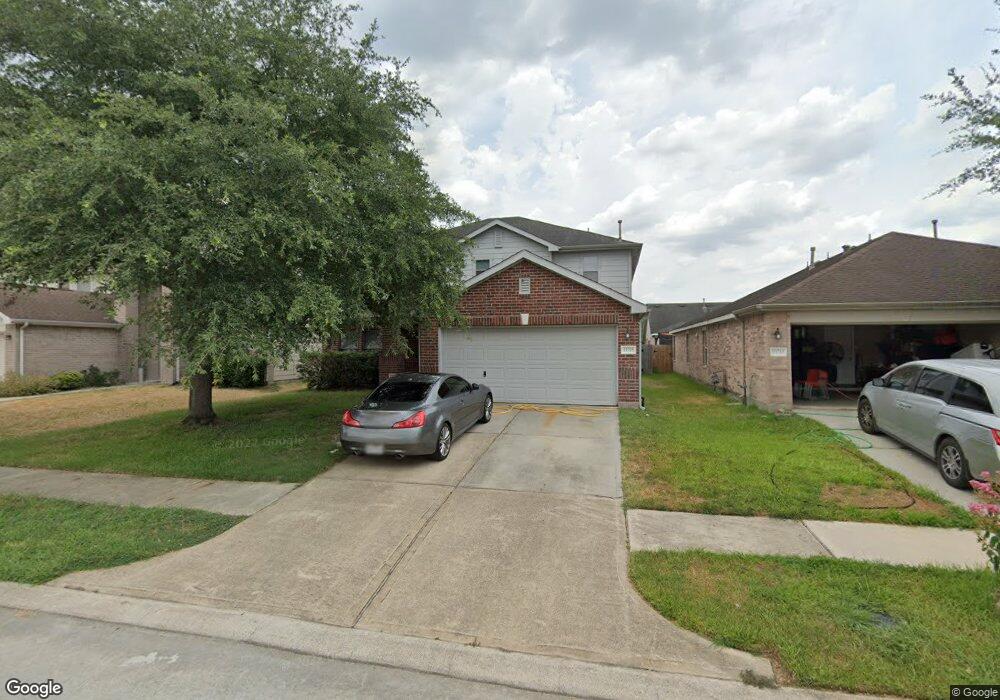
11718 Wainscot Ct Houston, TX 77038
North Houston NeighborhoodEstimated Value: $278,209 - $292,000
4
Beds
3
Baths
2,940
Sq Ft
$97/Sq Ft
Est. Value
About This Home
This home is located at 11718 Wainscot Ct, Houston, TX 77038 and is currently estimated at $285,802, approximately $97 per square foot. 11718 Wainscot Ct is a home located in Harris County with nearby schools including Kujawa EC/Pre-K/K School, Carter Academy, and Shotwell Middle School.
Ownership History
Date
Name
Owned For
Owner Type
Purchase Details
Closed on
Aug 29, 2011
Sold by
Baine James and Baine Jill
Bought by
Mayes Milton R and Mayes Charolette R
Current Estimated Value
Home Financials for this Owner
Home Financials are based on the most recent Mortgage that was taken out on this home.
Original Mortgage
$112,571
Outstanding Balance
$77,051
Interest Rate
4.25%
Mortgage Type
FHA
Estimated Equity
$208,751
Purchase Details
Closed on
Mar 31, 2011
Sold by
Deutsche Bank National Trust Company
Bought by
Baine James
Purchase Details
Closed on
Sep 7, 2010
Sold by
Peterson Janice Moore and Peterson Marion G
Bought by
Deutsche Bank National Trust Company
Purchase Details
Closed on
Mar 20, 2006
Sold by
Kb Home Lone Star Lp
Bought by
Peterson Marion G and Peterson Janice Moore
Home Financials for this Owner
Home Financials are based on the most recent Mortgage that was taken out on this home.
Original Mortgage
$118,732
Interest Rate
8.65%
Mortgage Type
Balloon
Create a Home Valuation Report for This Property
The Home Valuation Report is an in-depth analysis detailing your home's value as well as a comparison with similar homes in the area
Home Values in the Area
Average Home Value in this Area
Purchase History
| Date | Buyer | Sale Price | Title Company |
|---|---|---|---|
| Mayes Milton R | -- | Etc | |
| Baine James | -- | None Available | |
| Deutsche Bank National Trust Company | $100,000 | None Available | |
| Peterson Marion G | -- | First American Title |
Source: Public Records
Mortgage History
| Date | Status | Borrower | Loan Amount |
|---|---|---|---|
| Open | Mayes Milton R | $112,571 | |
| Previous Owner | Peterson Marion G | $118,732 | |
| Previous Owner | Peterson Marion G | $118,732 |
Source: Public Records
Tax History Compared to Growth
Tax History
| Year | Tax Paid | Tax Assessment Tax Assessment Total Assessment is a certain percentage of the fair market value that is determined by local assessors to be the total taxable value of land and additions on the property. | Land | Improvement |
|---|---|---|---|---|
| 2025 | $6,727 | $284,954 | $54,175 | $230,779 |
| 2024 | $6,727 | $268,918 | $54,175 | $214,743 |
| 2023 | $6,727 | $298,576 | $54,175 | $244,401 |
| 2022 | $7,333 | $263,694 | $30,250 | $233,444 |
| 2021 | $6,925 | $200,421 | $30,250 | $170,171 |
| 2020 | $6,650 | $194,475 | $30,250 | $164,225 |
| 2019 | $6,227 | $182,534 | $22,000 | $160,534 |
| 2018 | $1,850 | $165,362 | $22,000 | $143,362 |
| 2017 | $4,989 | $165,362 | $22,000 | $143,362 |
| 2016 | $4,535 | $165,362 | $22,000 | $143,362 |
| 2015 | $3,378 | $165,362 | $22,000 | $143,362 |
| 2014 | $3,378 | $121,292 | $22,000 | $99,292 |
Source: Public Records
Map
Nearby Homes
- 11707 Madison Oak St
- 2907 Valiant Scene Ct
- 11623 Quinn Ridge Way
- 2934 Valiant Scene Ct
- 2746 Piney Lake Ct
- 2743 Oriole Wood Ct
- 12006 Mallard Stream Ct
- 12007 Bach Orchard Trail
- 12015 Audubon Hill Ct
- 11638 Township Dale Ct
- 12026 Madison Oak St
- 11726 Wren Crossing Dr
- 11727 State Highway 249
- 2934 Washington Dr
- 12042 Mallard Stream Ct
- 2930 Washington Dr
- 11618 Wren Crossing Dr
- 9218 Washington Dr
- 9217 Washington Dr
- 9206 Washington Dr
- 11714 Wainscot Ct
- 11722 Wainscot Ct
- 11726 Wainscot Ct
- 11715 Tempera Ct
- 11710 Wainscot Ct
- 11711 Tempera Ct
- 11719 Tempera Ct
- 11706 Wainscot Ct
- 11723 Tempera Ct
- 11707 Tempera Ct
- 11719 Wainscot Ct
- 11723 Wainscot Ct
- 11715 Wainscot Ct
- 11727 Wainscot Ct
- 11703 Tempera Ct
- 11711 Wainscot Ct
- 11731 Wainscot Ct
- 11707 Wainscot Ct
- 2922 Redwing Grove Way
- 2926 Redwing Grove Way