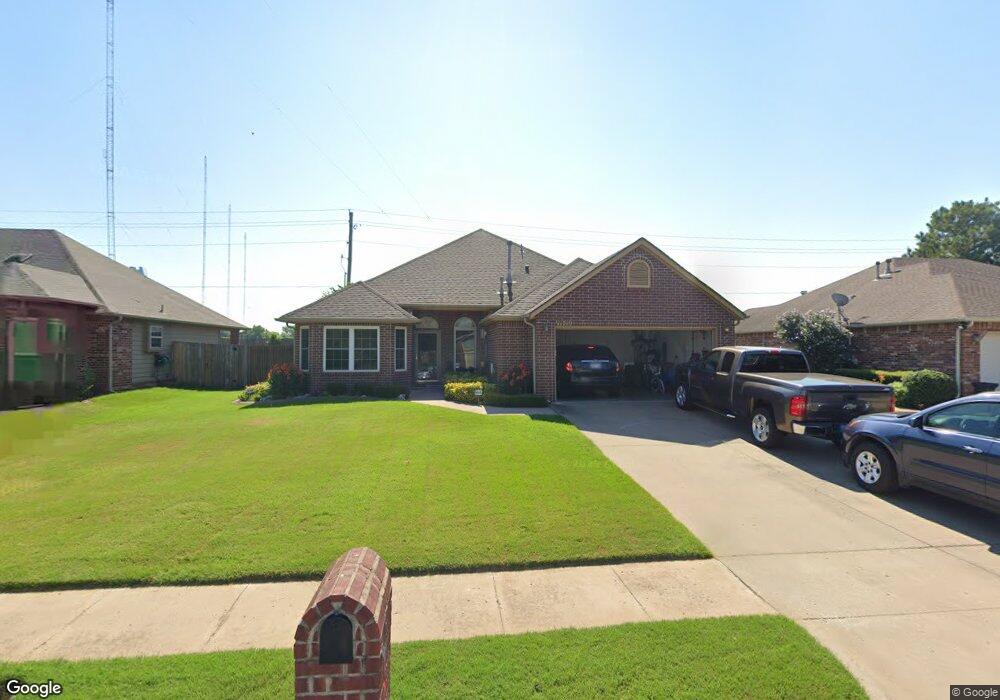
11719 S 105th East Ave Bixby, OK 74008
North Bixby NeighborhoodEstimated Value: $270,000 - $297,000
3
Beds
2
Baths
1,896
Sq Ft
$150/Sq Ft
Est. Value
About This Home
This home is located at 11719 S 105th East Ave, Bixby, OK 74008 and is currently estimated at $284,914, approximately $150 per square foot. 11719 S 105th East Ave is a home located in Tulsa County with nearby schools including Bixby East Elementary, Bixby Middle School, and Bixby High School.
Ownership History
Date
Name
Owned For
Owner Type
Purchase Details
Closed on
Apr 15, 2015
Sold by
Gilreath Terr A and Gilreath Helen M
Bought by
Gilreath Terra A and Gilreath Helen M
Current Estimated Value
Purchase Details
Closed on
Apr 3, 2009
Sold by
Phillips Glendle and Phillips Barbara A
Bought by
Gilreath Terry A and Gilreath Helen M
Home Financials for this Owner
Home Financials are based on the most recent Mortgage that was taken out on this home.
Original Mortgage
$123,200
Outstanding Balance
$79,128
Interest Rate
5.24%
Mortgage Type
New Conventional
Estimated Equity
$205,786
Purchase Details
Closed on
Apr 27, 2000
Sold by
Rex Alexander Enterprises Inc
Bought by
Patterson Marc Thomas and Patterson Shelley
Home Financials for this Owner
Home Financials are based on the most recent Mortgage that was taken out on this home.
Original Mortgage
$121,464
Interest Rate
8.19%
Mortgage Type
FHA
Create a Home Valuation Report for This Property
The Home Valuation Report is an in-depth analysis detailing your home's value as well as a comparison with similar homes in the area
Home Values in the Area
Average Home Value in this Area
Purchase History
| Date | Buyer | Sale Price | Title Company |
|---|---|---|---|
| Gilreath Terra A | -- | None Available | |
| Gilreath Terry A | $154,000 | None Available | |
| Patterson Marc Thomas | $122,500 | Meridian Title & Closing Inc |
Source: Public Records
Mortgage History
| Date | Status | Borrower | Loan Amount |
|---|---|---|---|
| Open | Gilreath Terry A | $123,200 | |
| Previous Owner | Patterson Marc Thomas | $121,464 |
Source: Public Records
Tax History Compared to Growth
Tax History
| Year | Tax Paid | Tax Assessment Tax Assessment Total Assessment is a certain percentage of the fair market value that is determined by local assessors to be the total taxable value of land and additions on the property. | Land | Improvement |
|---|---|---|---|---|
| 2024 | $2,450 | $18,066 | $1,608 | $16,458 |
| 2023 | $2,450 | $18,511 | $1,763 | $16,748 |
| 2022 | $2,385 | $16,972 | $2,114 | $14,858 |
| 2021 | $2,160 | $16,448 | $2,049 | $14,399 |
| 2020 | $2,107 | $15,940 | $2,322 | $13,618 |
| 2019 | $2,115 | $15,940 | $2,322 | $13,618 |
| 2018 | $2,095 | $15,940 | $2,322 | $13,618 |
| 2017 | $2,082 | $16,940 | $2,468 | $14,472 |
| 2016 | $2,056 | $16,940 | $2,468 | $14,472 |
| 2015 | $1,967 | $16,940 | $2,468 | $14,472 |
| 2014 | $1,964 | $16,940 | $2,468 | $14,472 |
Source: Public Records
Map
Nearby Homes
- 12509 S 102nd East Ave
- 15404 S 34th East Ave
- 11631 S 103rd East Ave
- 10842 E 115th Place S
- 11612 S 101st East Ave
- 10306 E 114th Place S
- 11611 S 100th East Ave
- 13114 S 100th East Ave
- 9907 E 118th St S
- 9905 E 117th Place S
- 9923 E 119th Place S
- 11310 S 106th East Ave
- 11318 S 108th East Place
- 11306 S 108th East Ave
- 13456 S 101st East Ave
- 13506 S 101st Ave E
- 12215 S 99th East Ave
- 3276 E 169th St S
- 3259 E 169th St S
- 3243 E 169th St S
- 11723 S 105th East Ave
- 11715 S 105th East Ave
- 11709 S 105th Ave E
- 11709 S 105th East Ave
- 11729 S 105th East Ave
- 11720 S 105th East Ave
- 11716 S 105th East Ave
- 11724 S 105th East Ave
- 11712 S 105th East Ave
- 11705 S 105th East Ave
- 11730 S 105th East Ave
- 11706 S 105th East Ave
- 11721 S 104th East Ave
- 11805 S 105th East Ave
- 11717 S 104th East Ave
- 11633 S 105th East Ave
- 11804 S 105th East Ave
- 11725 S 104th East Ave
- 11713 S 104th East Ave
- 11702 S 105th East Ave