Estimated Value: $136,000 - $185,000
3
Beds
1
Bath
1,305
Sq Ft
$127/Sq Ft
Est. Value
About This Home
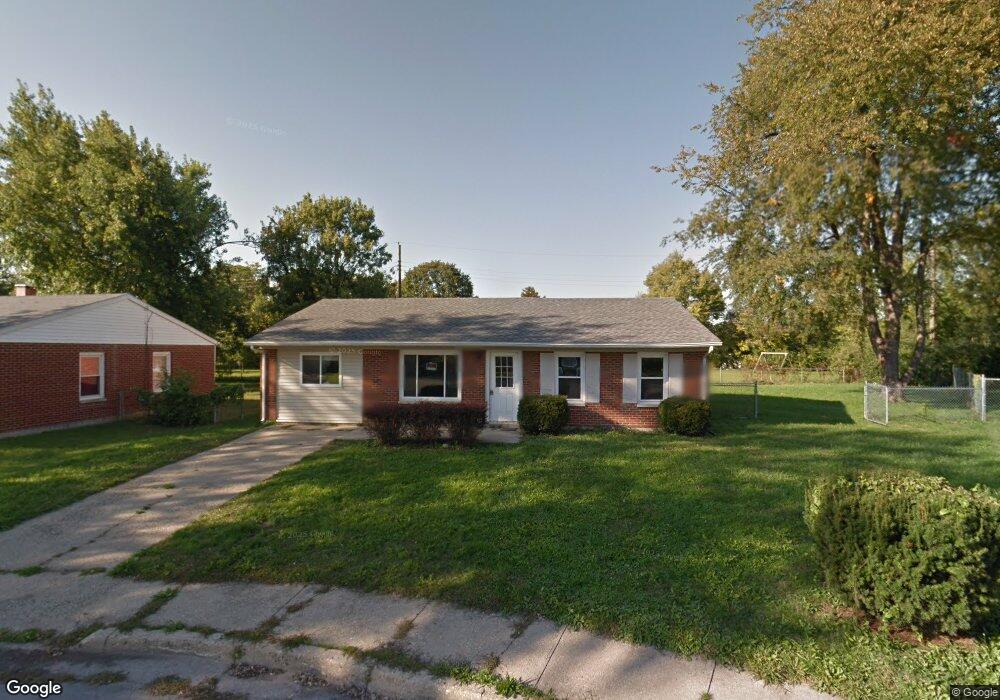
This home is located at 1172 Crowden Ct, Xenia, OH 45385 and is currently estimated at $165,852, approximately $127 per square foot. 1172 Crowden Ct is a home located in Greene County with nearby schools including Xenia High School, Summit Academy Community School for Alternative Learners - Xenia, and Legacy Christian Academy.
Ownership History
Date
Name
Owned For
Owner Type
Purchase Details
Closed on
Sep 5, 2012
Sold by
Tambe Claire
Bought by
Tipton Brenda G
Current Estimated Value
Home Financials for this Owner
Home Financials are based on the most recent Mortgage that was taken out on this home.
Original Mortgage
$62,349
Outstanding Balance
$43,507
Interest Rate
3.75%
Mortgage Type
FHA
Estimated Equity
$122,345
Purchase Details
Closed on
Sep 13, 2011
Sold by
Us Bank National Association Nd
Bought by
Tambe Claire
Purchase Details
Closed on
Jul 27, 2011
Sold by
Baker Micheal L and Baker Michael L
Bought by
Us Bank National Association
Purchase Details
Closed on
Dec 11, 1998
Sold by
Stiffler Timothy W and Stiffler Virginia
Bought by
Baker Ryan J and Baker Michael L
Home Financials for this Owner
Home Financials are based on the most recent Mortgage that was taken out on this home.
Original Mortgage
$71,702
Interest Rate
6.96%
Mortgage Type
FHA
Create a Home Valuation Report for This Property
The Home Valuation Report is an in-depth analysis detailing your home's value as well as a comparison with similar homes in the area
Home Values in the Area
Average Home Value in this Area
Purchase History
| Date | Buyer | Sale Price | Title Company |
|---|---|---|---|
| Tipton Brenda G | $63,500 | None Available | |
| Tambe Claire | $40,000 | Attorney | |
| Us Bank National Association | $56,000 | Attorney | |
| Baker Ryan J | $72,500 | -- |
Source: Public Records
Mortgage History
| Date | Status | Borrower | Loan Amount |
|---|---|---|---|
| Open | Tipton Brenda G | $62,349 | |
| Previous Owner | Baker Ryan J | $71,702 |
Source: Public Records
Tax History Compared to Growth
Tax History
| Year | Tax Paid | Tax Assessment Tax Assessment Total Assessment is a certain percentage of the fair market value that is determined by local assessors to be the total taxable value of land and additions on the property. | Land | Improvement |
|---|---|---|---|---|
| 2024 | $1,314 | $41,320 | $10,330 | $30,990 |
| 2023 | $1,314 | $41,320 | $10,330 | $30,990 |
| 2022 | $1,443 | $28,770 | $7,370 | $21,400 |
| 2021 | $1,463 | $28,770 | $7,370 | $21,400 |
| 2020 | $1,401 | $28,770 | $7,370 | $21,400 |
| 2019 | $1,234 | $23,850 | $4,890 | $18,960 |
| 2018 | $1,239 | $23,850 | $4,890 | $18,960 |
| 2017 | $1,161 | $23,850 | $4,890 | $18,960 |
| 2016 | $1,161 | $21,940 | $4,890 | $17,050 |
| 2015 | $1,165 | $21,940 | $4,890 | $17,050 |
| 2014 | $1,115 | $21,940 | $4,890 | $17,050 |
Source: Public Records
Map
Nearby Homes
- 1223 June Dr
- 1233 June Dr
- 1342 Kylemore Dr
- 1283 June Dr
- 1391 June Dr
- 1144 Rockwell Dr
- 343 Sheelin Rd
- 1351 Omard Dr
- 305-325 Bellbrook Ave
- 883 Omard Dr
- 912 Omard Dr
- 509 Antrim Rd
- 1208 Bellbrook Ave
- 453 Walnut St
- 1272 Bellbrook Ave
- 1568 Cheyenne Dr
- 121 S Progress Dr
- 1618 Navajo Dr
- 293 S Miami Ave
- 1653 Seneca Dr
- 1184 Crowden Ct
- 1164 Crowden Ct
- 1196 Crowden Ct
- 1167 Circle Dr
- 1165 Crowden Ct
- 1169 Crowden Ct
- 1185 Crowden Ct
- 1161 Circle Dr
- 1208 Crowden Ct
- 159 Massie Dr
- 82 Haddon Ct
- 1199 Crowden Ct
- 1171 Circle Dr
- 1155 Circle Dr
- 1222 Crowden Ct
- 1211 Crowden Ct
- 83 Haddon Ct
- 1143 Circle Dr
- 139 Massie Dr
- 1177 Circle Dr