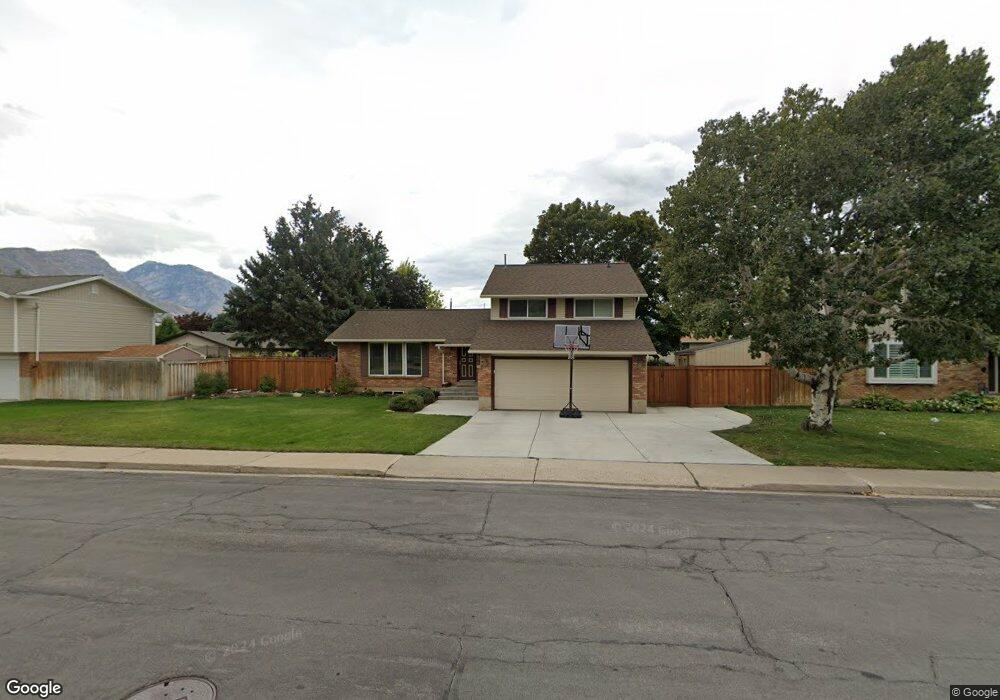
1172 E 600 N Orem, UT 84097
Orchard South NeighborhoodEstimated Value: $579,000 - $619,000
3
Beds
3
Baths
2,595
Sq Ft
$230/Sq Ft
Est. Value
About This Home
This home is located at 1172 E 600 N, Orem, UT 84097 and is currently estimated at $597,715, approximately $230 per square foot. 1172 E 600 N is a home located in Utah County with nearby schools including Foothill Elementary School, Canyon View Junior High School, and Orem High School.
Ownership History
Date
Name
Owned For
Owner Type
Purchase Details
Closed on
Oct 7, 2016
Sold by
Kenneth R Johnson
Bought by
Carling Gregory and Carling Patricia
Current Estimated Value
Home Financials for this Owner
Home Financials are based on the most recent Mortgage that was taken out on this home.
Original Mortgage
$217,500
Outstanding Balance
$174,145
Interest Rate
3.42%
Estimated Equity
$423,570
Purchase Details
Closed on
Nov 28, 2005
Sold by
Harline Richard D and The Harline Living Trust
Bought by
Johnson Kenneth R and Johnson Claudine L
Home Financials for this Owner
Home Financials are based on the most recent Mortgage that was taken out on this home.
Original Mortgage
$150,000
Interest Rate
6.07%
Mortgage Type
Fannie Mae Freddie Mac
Create a Home Valuation Report for This Property
The Home Valuation Report is an in-depth analysis detailing your home's value as well as a comparison with similar homes in the area
Home Values in the Area
Average Home Value in this Area
Purchase History
| Date | Buyer | Sale Price | Title Company |
|---|---|---|---|
| Carling Gregory | -- | -- | |
| Johnson Kenneth R | -- | United Title Services |
Source: Public Records
Mortgage History
| Date | Status | Borrower | Loan Amount |
|---|---|---|---|
| Open | Carling Gregory | $217,500 | |
| Closed | Carling Gregory | -- | |
| Previous Owner | Johnson Kenneth R | $150,000 |
Source: Public Records
Tax History
| Year | Tax Paid | Tax Assessment Tax Assessment Total Assessment is a certain percentage of the fair market value that is determined by local assessors to be the total taxable value of land and additions on the property. | Land | Improvement |
|---|---|---|---|---|
| 2025 | $2,229 | $295,405 | -- | -- |
| 2024 | $2,229 | $272,580 | $0 | $0 |
| 2023 | $2,027 | $266,420 | $0 | $0 |
| 2022 | $2,127 | $270,765 | $0 | $0 |
| 2021 | $1,790 | $345,200 | $152,300 | $192,900 |
| 2020 | $1,640 | $310,900 | $121,800 | $189,100 |
| 2019 | $1,523 | $300,200 | $111,100 | $189,100 |
| 2018 | $1,444 | $271,900 | $107,500 | $164,400 |
| 2017 | $1,301 | $139,920 | $0 | $0 |
| 2016 | -- | $109,010 | $0 | $0 |
| 2015 | $1,123 | $98,780 | $0 | $0 |
| 2014 | $989 | $86,570 | $0 | $0 |
Source: Public Records
Map
Nearby Homes
- 566 N Bella Vista Dr
- 551 N 900 E
- 80 N 1200 E
- 5005 N Edgewood Dr Unit 310
- 181 N 800 E
- 150 N 750 E
- 85 S 1000 E
- 471 E 700 N
- 976 N 560 E
- 112 S 1000 E
- 221 E 4735 N
- 710 E 1280 N
- 337 Birchwood Dr
- 362 E 800 N Unit 1
- 1324 N 750 E Unit 3
- 307 E Elmwood Dr
- 285 Three Fountains Dr
- 733 E 1450 N Unit 5
- 305 E Elmwood Dr
- 1356 N 750 E Unit 11
Your Personal Tour Guide
Ask me questions while you tour the home.